A drought map can look simple at first: a few colors spread across counties, states, or whole regions. The meaning behind those colors is more complicated. Drought is not just a week without rain, and it is not measured by rainfall alone. It can show up in dry soil, low streamflow, shrinking reservoirs, stressed crops, wildfire risk, poor pasture conditions, or wells that have to reach deeper for water.
The U.S. Drought Monitor is one of the most widely used tools for turning those conditions into a national picture. Released each Thursday, it shows where drought is happening across the United States and its territories and how intense it is. The map matters because drought can build quietly, affect different places in different ways, and last long after a single storm passes through. Reading it well means understanding both what the categories say and what they cannot say by themselves.
The colors are not just rainfall totals
The U.S. Drought Monitor uses a set of categories that run from normal conditions through abnormally dry conditions and into four levels of drought. D0 means abnormally dry. It is not counted as drought, but it can show that a place may be moving toward drought or recovering from one. D1 is moderate drought, D2 is severe drought, D3 is extreme drought, and D4 is exceptional drought. The higher the number, the more unusual and damaging the moisture shortage is likely to be.
That scale can be tempting to read as a simple ranking of how little rain has fallen. Rainfall is important, but drought is a broader moisture problem. A region might get a decent rainstorm and still remain in drought if deeper soil, groundwater, rivers, or reservoirs have not recovered. Another area might have below-normal rainfall but avoid serious impacts because it began the season with strong snowpack or full reservoirs. The map tries to summarize the whole situation, not just the last few days of weather.
This is why two nearby places can respond differently to the same dry spell. Sandy soil may lose moisture quickly. Clay-heavy soil may hold water longer but become hard when it dries. A mountain region may depend on winter snowpack that melts slowly into rivers. A farming region may care deeply about soil moisture during planting and pollination, while a city may focus on reservoir levels and water restrictions. The color on the map is the result of several signals being weighed together.

What D0 through D4 mean in real life
The D categories are built to show intensity, but the labels make more sense when connected to everyday effects. D0, abnormally dry, is often a warning sign. Lawns may brown earlier than usual, stream levels may start to fall, or farmers may notice that fields need rain soon. It can also appear when a place is improving after drought but has not fully returned to normal.
D1, moderate drought, usually means dryness has become more than a short-term inconvenience. Pastures may grow more slowly, unirrigated crops may show stress, and small streams can run lower than expected. D2, severe drought, points to a more serious shortage. Crop yields may suffer, fire danger may rise, and water managers may begin closer monitoring or restrictions depending on local conditions.
D3 and D4 are reserved for the most intense situations. In extreme drought, major agricultural losses, very low water supplies, and wider ecological stress become more likely. Exceptional drought is the most severe category. It signals rare conditions that can strain farms, ecosystems, towns, utilities, and emergency planning at the same time. The exact impacts still depend on the place. A D3 in a wheat-growing region, a forested mountain area, and a desert city may not look identical on the ground.
The categories are useful because they give readers a shared language. A person in one state and a person across the country can both understand that D4 is more serious than D1. Still, the map should not be read as a precise household forecast. It does not tell one family whether their private well will fail, whether a specific field will lose yield, or whether a local stream will close to recreation. It points to regional conditions that deserve closer attention.
Why drought is measured with many clues
Drought.gov describes drought monitoring as a process that uses indicators such as precipitation, temperature, streamflow, groundwater and reservoir levels, soil moisture, and snowpack. That variety matters because drought is slow and layered. A rainy week can green up grass while deeper water supplies stay low. A hot, windy month can dry soil even if rainfall has not been extremely low. Snowpack can make a western river basin look safer in spring, then become a concern if it melts too early or too quickly.
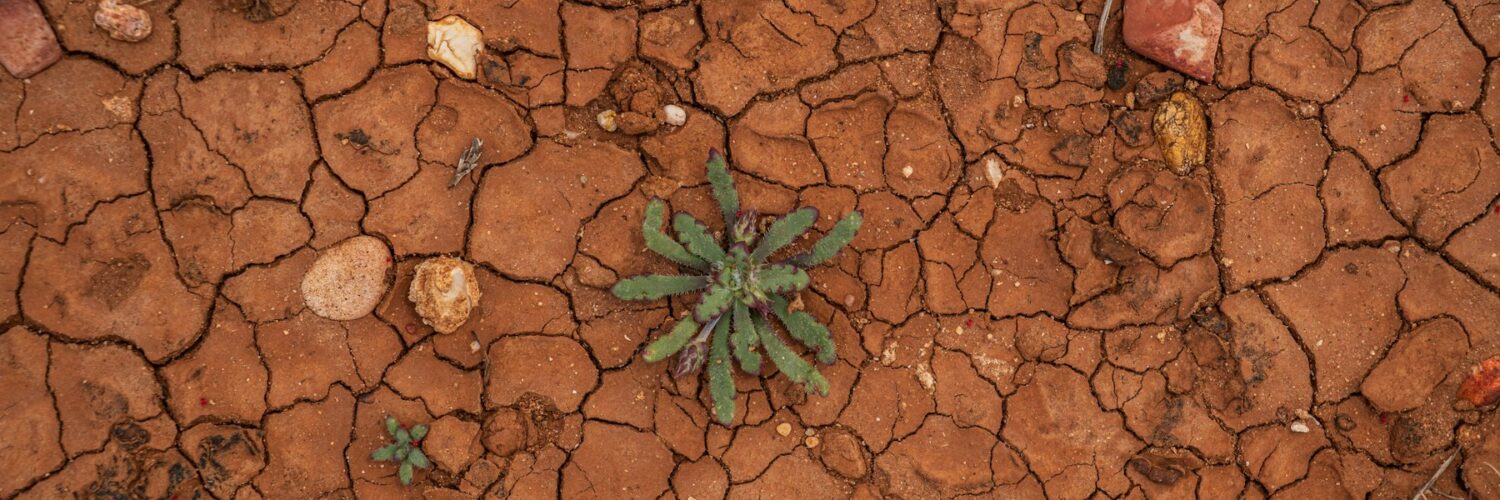
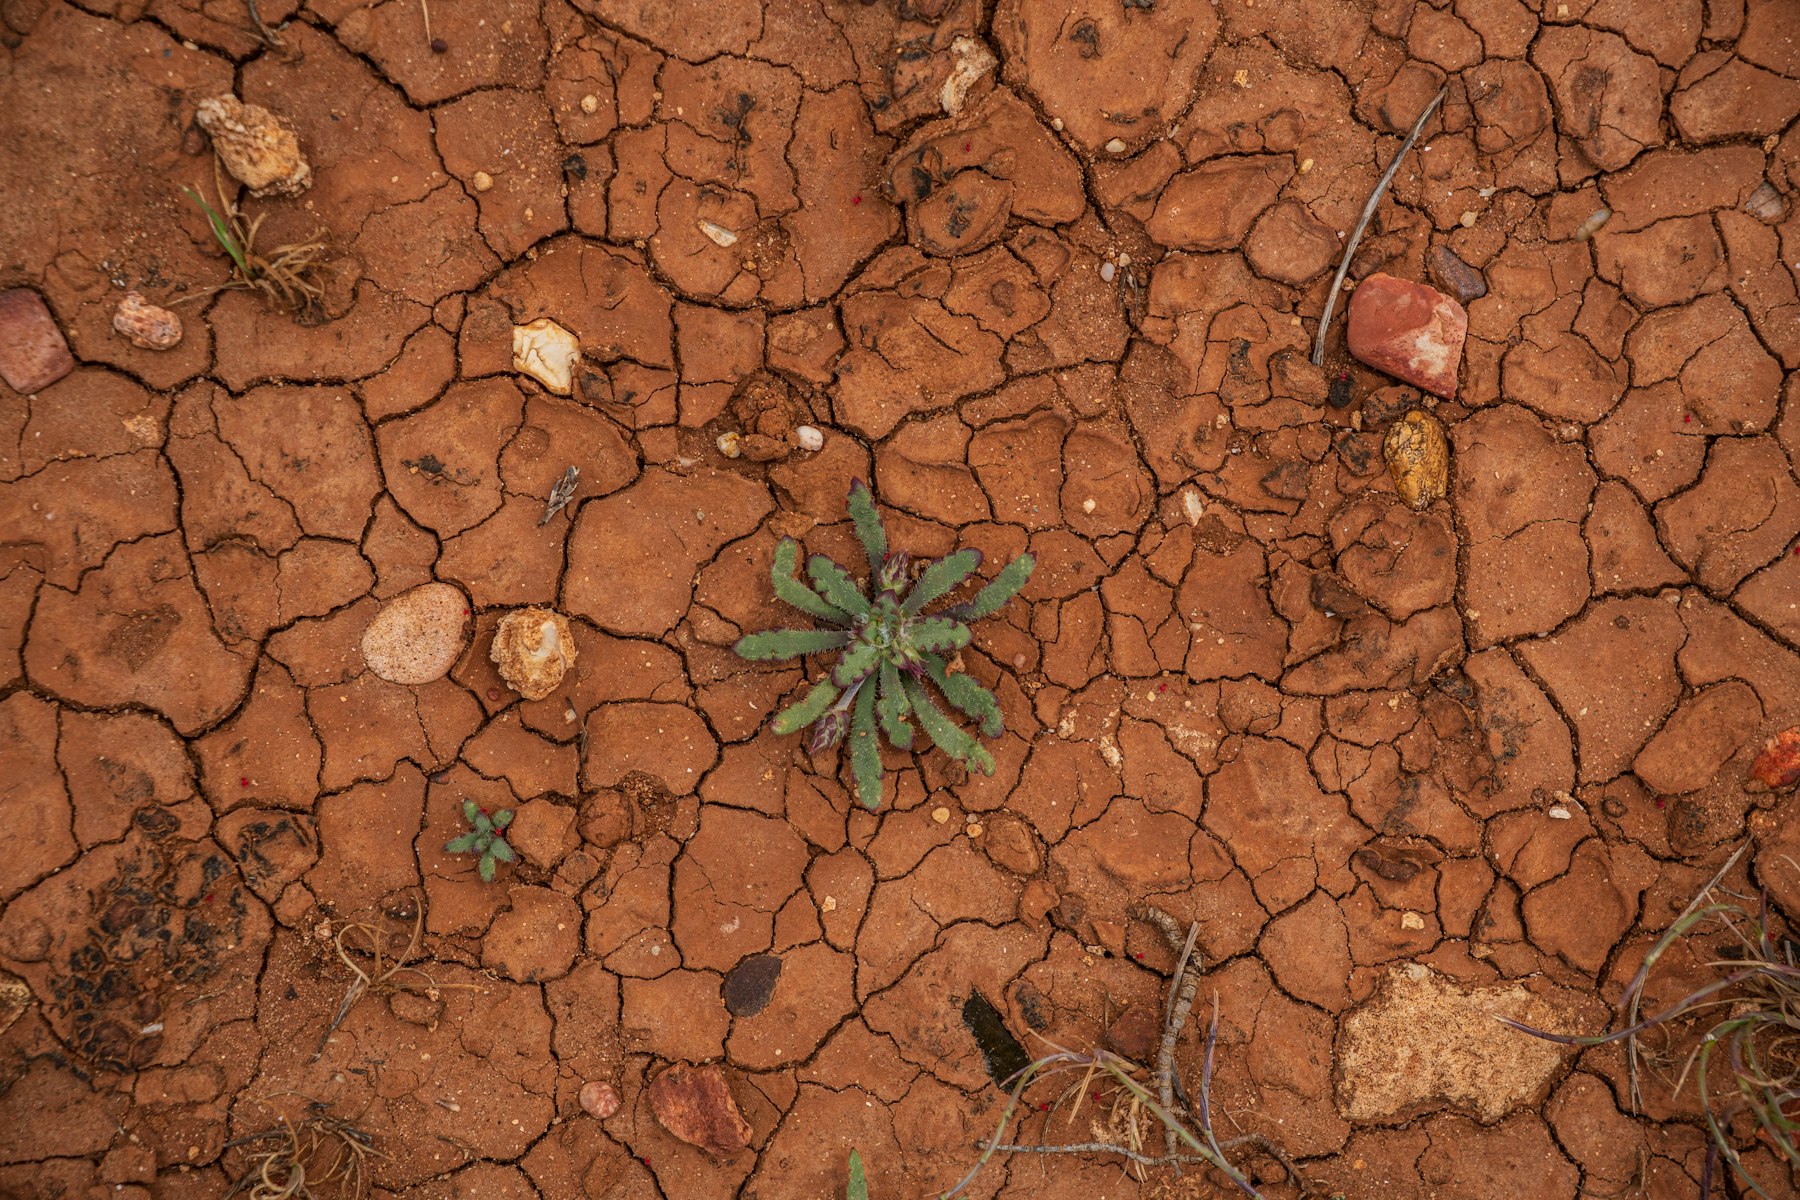
Soil moisture is one of the most important clues because plants depend on water stored in the ground, not just water falling from the sky. When soil dries out near the surface, seedlings and grasses can suffer quickly. When deeper root-zone moisture drops, trees, crops, and pastures can struggle for longer. In fast-developing situations sometimes called flash droughts, heat, wind, and high evaporative demand can pull moisture from soil rapidly, causing stress before people expect a classic long drought.
Surface water and groundwater add another layer. Reservoirs, streams, lakes, and aquifers respond on different time scales. A stream can rise after rain, while groundwater recovers much more slowly. A reservoir can stay healthy for a while because of earlier snowmelt, then become a concern if dry conditions continue. This is why drought monitoring cannot depend on one number. The strongest readings combine recent weather, longer-term water storage, plant response, and local reports from people who know the landscape.
How local judgment shapes the map
The U.S. Drought Monitor is not just a computer model. It brings together data and expert judgment. Authors review many indicators, compare current conditions with historical patterns, and consider reports from local observers. That human review is important because drought does not affect every region in the same way. The same rainfall deficit can be minor in one climate and serious in another.
Local context helps explain why the map may not change instantly after one storm. If a region has been dry for months, a heavy rain may reduce fire danger or help topsoil but leave reservoirs, groundwater, or streamflow below normal. Map authors have to decide whether the improvement is broad and durable enough to reduce the drought category. The reverse can also happen. One dry week may not create drought if the region has strong water reserves and no clear impacts yet.
This judgment makes the map more useful, but it also means readers should watch patterns over time. A single weekly map shows a snapshot. Several weeks show the story. Expanding D0 areas can reveal dryness spreading before severe impacts arrive. A shrinking D2 or D3 area can show recovery, even if some local effects remain. Change maps and time series can help readers see whether conditions are worsening, improving, or shifting from one region to another.
Why the map matters beyond weather
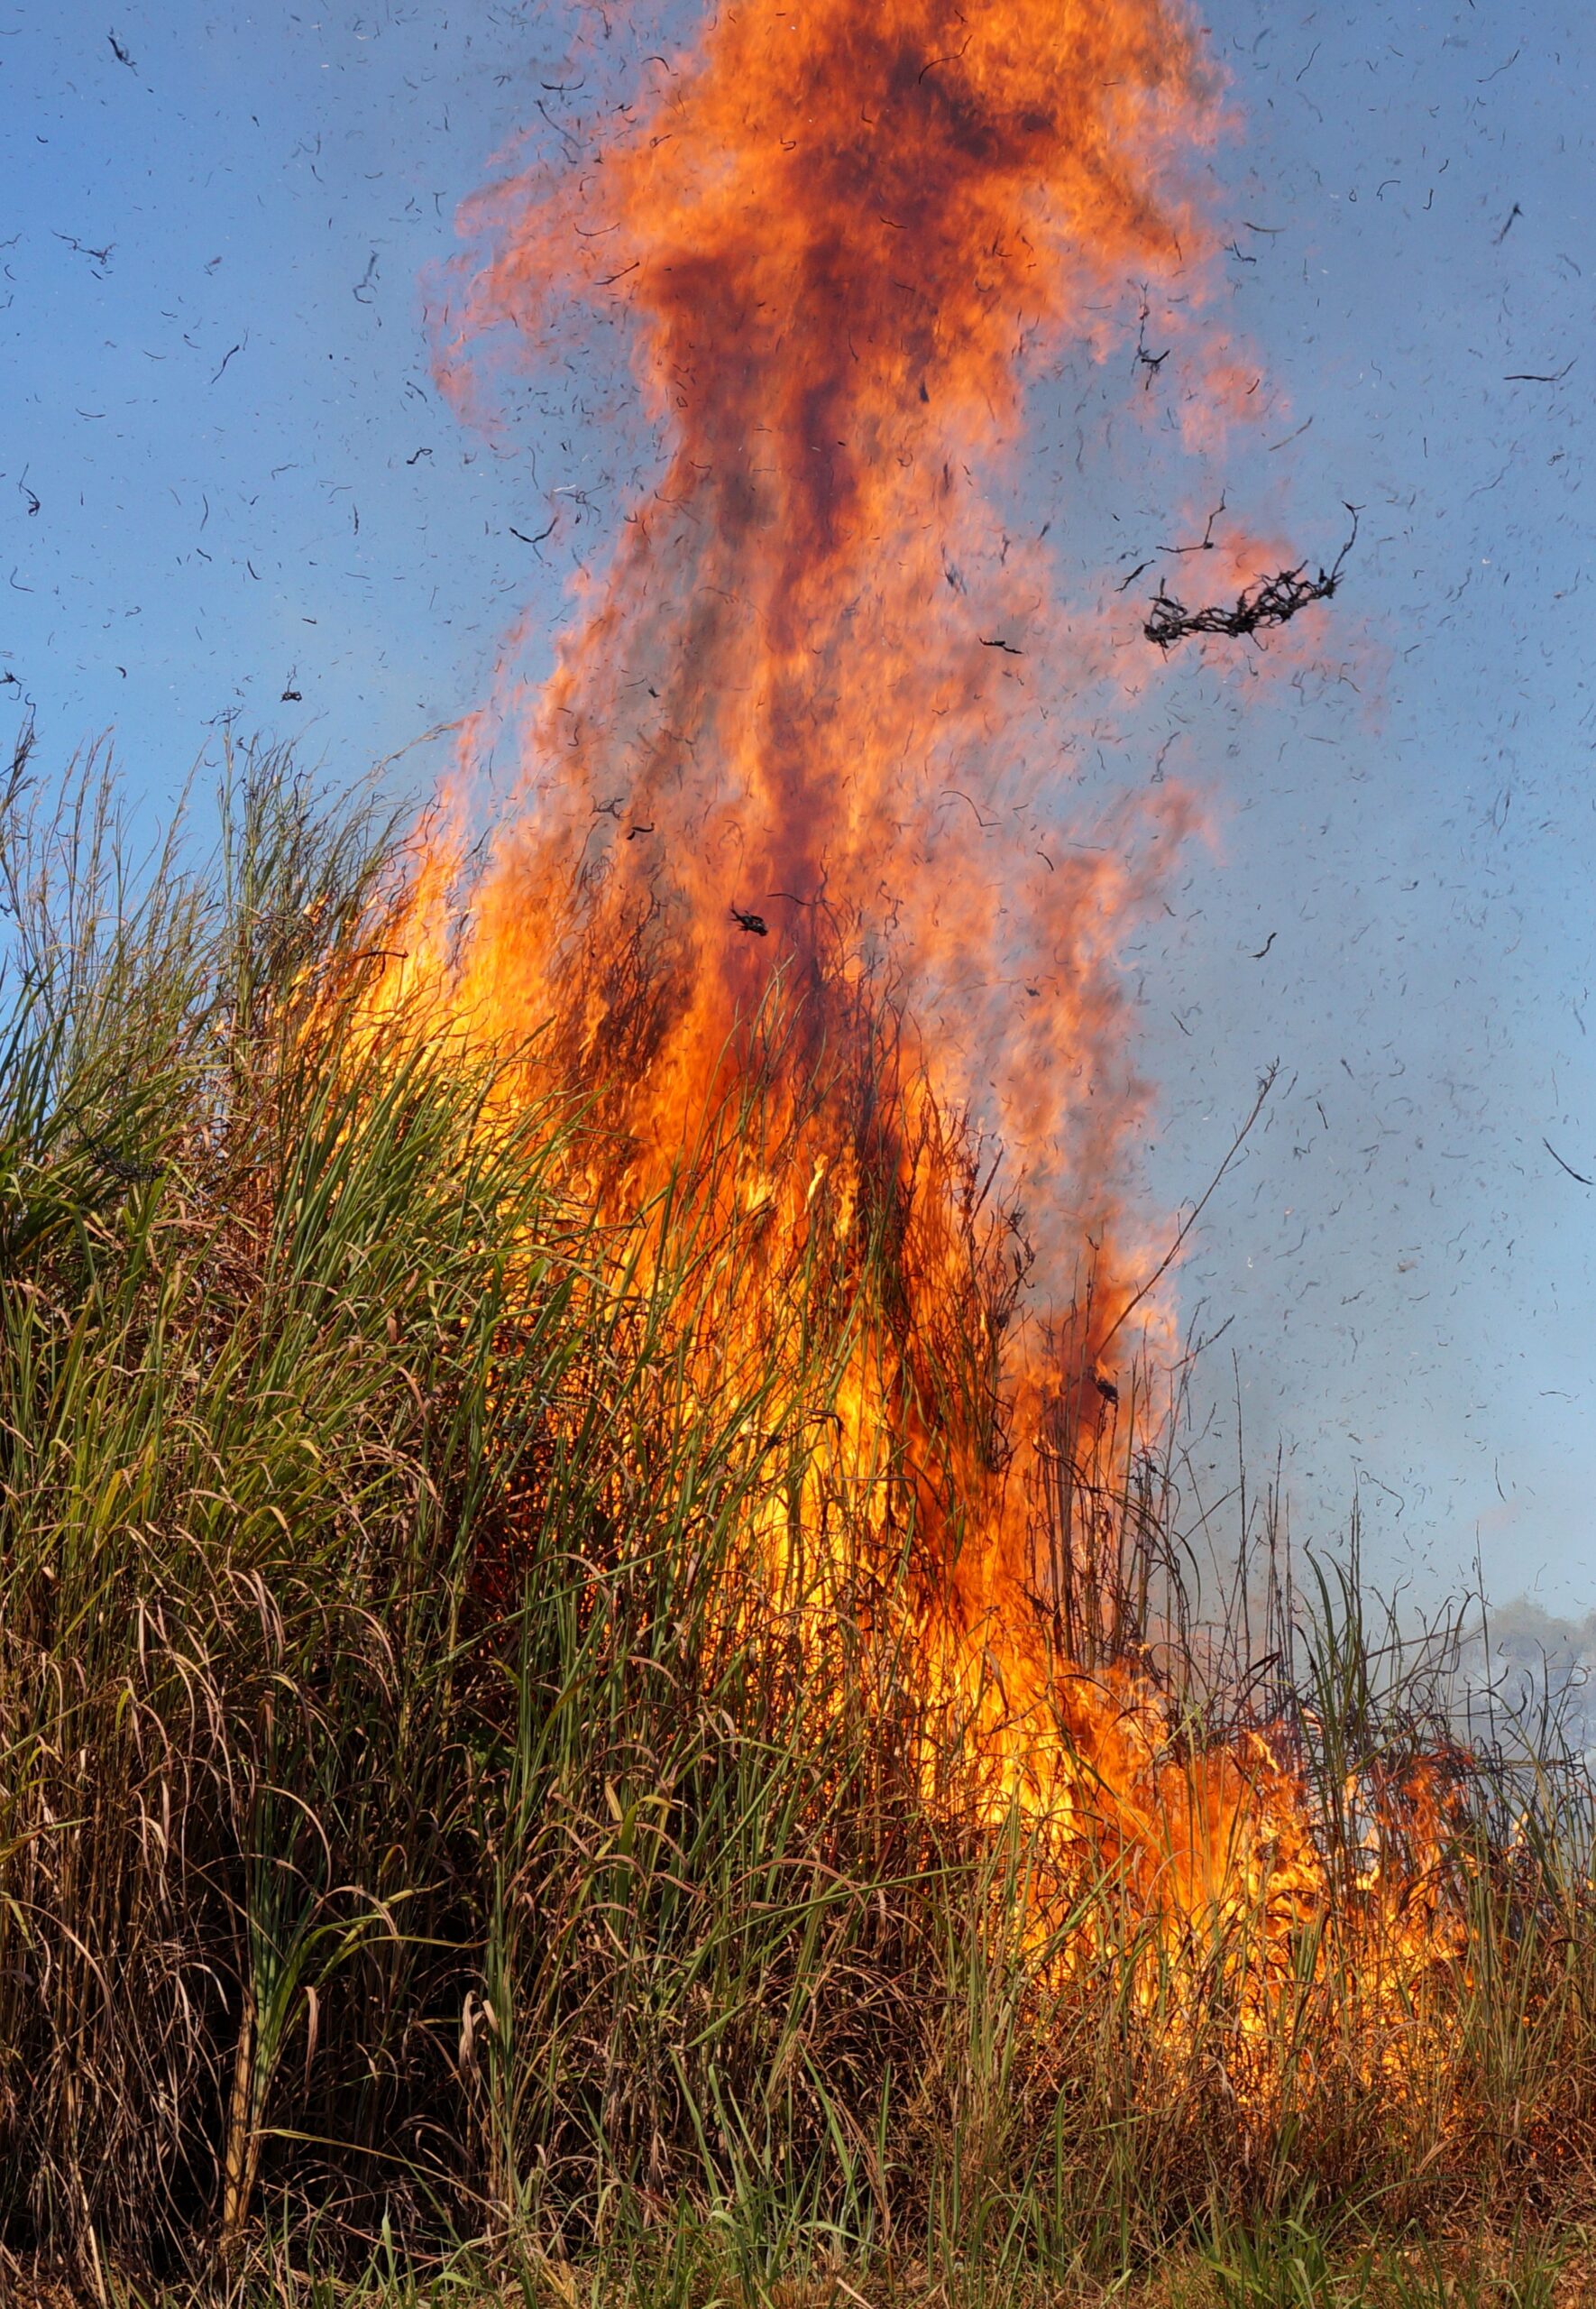
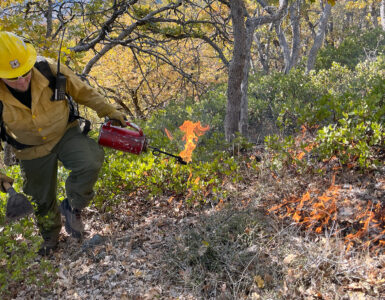
Drought reaches into food, energy, public health, ecosystems, and household planning. Drought.gov notes that agricultural drought can reduce both water availability and water quality for farms, ranches, and grazing lands. Crops may need more irrigation just when water supplies are under pressure. Ranchers may need extra feed when pasture growth slows. Dry vegetation can raise fire risk, especially when heat and wind arrive at the same time.
Communities also feel drought through water utilities, recreation, and natural systems. Low reservoirs can lead to conservation requests or restrictions. Streams and lakes can become warmer or shallower, stressing fish and wildlife. Forests weakened by drought may become more vulnerable to insects, disease, or fire. In cities, drought can change landscaping rules, park maintenance, and long-term water planning.
For students and general readers, the main value of the Drought Monitor is that it connects a familiar experience, dry weather, to larger systems. A brown lawn, a low river, and a water-use notice are not separate stories. They can be signs of the same moisture imbalance moving through land, plants, infrastructure, and daily life. The map gives that imbalance a visible shape.
How to read the map carefully
A good first step is to separate category from trend. The category tells how intense drought is in a place right now. The trend tells whether conditions are expanding, retreating, or holding steady. A D1 area that is growing quickly may deserve more attention than a stable D2 area that has begun to improve. The direction of change can be just as important as the color.
Next, look at scale. The national map is useful for seeing broad patterns, but state and regional views are better for local questions. Drought often follows river basins, storm tracks, elevation, soil type, and land use rather than political borders. A county line may be less meaningful than the mountains, plains, or watershed around it.
Finally, remember that drought recovery takes time. Rain can help immediately, but recovery may require repeated storms, cooler weather, restored soil moisture, improved streamflow, replenished reservoirs, or stronger snowpack. A drought map is not a verdict; it is a weekly reading of a changing water story. The more carefully readers treat it, the better they can understand why a place may still be in drought even after rain, or why early dryness can matter before the most serious impacts appear.


Add comment