
A hot afternoon can feel obvious without any calculation. The sidewalk radiates heat, air conditioners hum from windows and rooftops, and electricity use rises as millions of rooms try to stay livable. But weather agencies, utilities, and energy planners need more than a feeling. They need a way to compare one day, one month, or one region with another.
Cooling degree days do that job. They turn daily temperature into a simple measure of how much cooling demand the weather is likely to create. The number is not a perfect prediction of anyone’s electric bill, because buildings, insulation, humidity, thermostat settings, and electricity prices all matter too. Still, it is one of the clearest ways to see why a week of moderately hot days can sometimes matter more than one dramatic spike on a thermometer.
What a cooling degree day measures
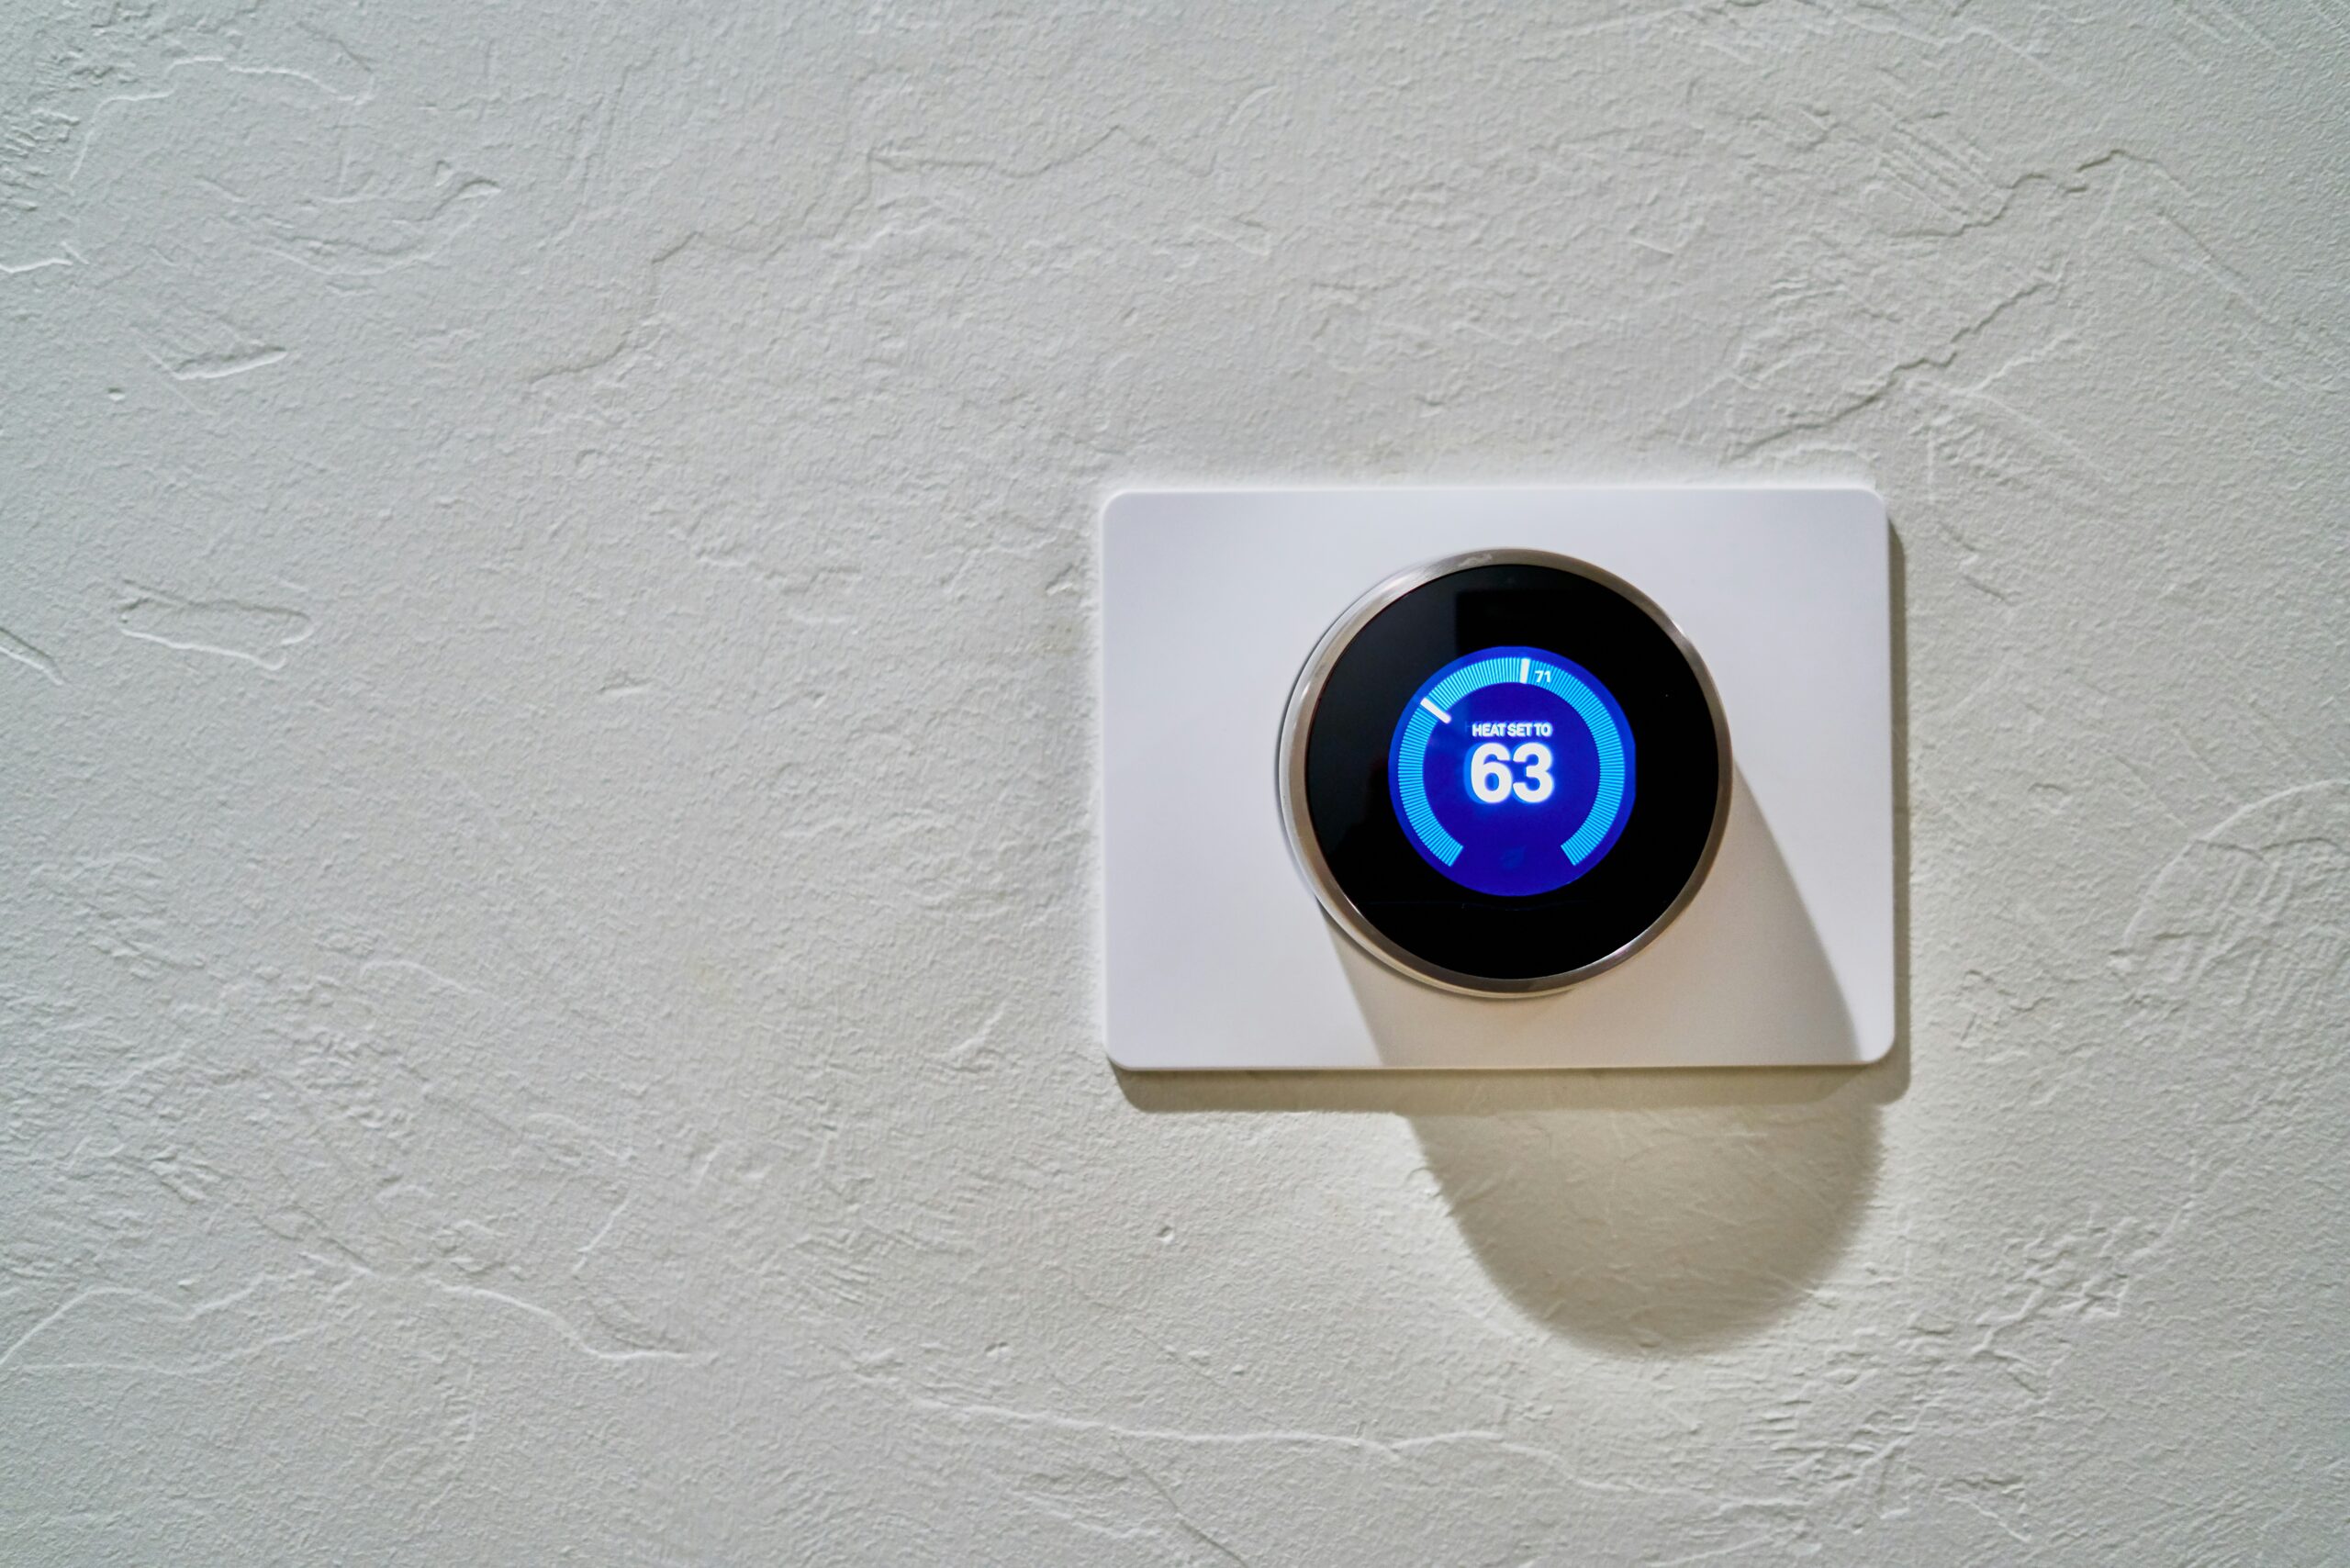
A cooling degree day compares a day’s average temperature with a baseline, usually 65°F in standard U.S. weather and energy reporting. The daily average is commonly estimated by adding the high temperature and low temperature, then dividing by two. If that average is above 65°F, the difference becomes the number of cooling degree days for that day. If the average is 65°F or lower, the day has zero cooling degree days.
The basic formula is simple: cooling degree days = average daily temperature – 65°F, but only when the average is above 65°F. A day with a high of 90°F and a low of 66°F has an average of 78°F. Subtract 65, and the result is 13 cooling degree days. The U.S. Energy Information Administration uses that same kind of example to show how hot weather can be translated into an estimate of cooling need.

The number is called a degree day because it combines temperature difference with time. A day averaging 75°F is not just warm; it is 10 degrees above the baseline for one day. Two such days add up to 20 cooling degree days. A month, a season, or a year can be compared by adding all the daily values together.
Heating degree days work in the opposite direction. When the average temperature is below 65°F, the gap below 65 becomes a measure of likely heating demand. Together, heating and cooling degree days give a rough picture of how weather pulls buildings away from a comfortable middle zone.
Why the 65°F baseline is useful but imperfect
The 65°F baseline does not mean every person feels perfectly comfortable at exactly 65°F. It is a long-used planning convention, not a universal law of comfort. Buildings gain heat from sunlight, appliances, people, cooking, and electronics. Some homes may need cooling when the outdoor average is lower than 65°F, while others may stay comfortable even when the average is higher.
The baseline is useful because it creates a shared measurement. The National Weather Service explains degree days as the difference between the mean daily temperature and 65°F, which makes the calculation easy to repeat across places and time periods. NOAA’s Climate Prediction Center also uses degree days to estimate weather-related energy demand and to compare expected demand across regions.
That shared yardstick matters because a single high temperature can be misleading. Suppose one city reaches 96°F in the afternoon but cools to 60°F overnight. Its average is 78°F, or 13 cooling degree days. Another city reaches only 88°F but stays at 76°F overnight. Its average is 82°F, or 17 cooling degree days. The second city had the lower peak temperature, but buildings may have had less chance to release heat overnight.
This is why warm nights often matter so much during heat waves. A cooler night lets walls, roofs, pavement, and indoor air shed some stored heat. When nights stay hot, air conditioners may run longer, people sleep less comfortably, and the next day begins from a warmer starting point. Cooling degree days capture that sustained warmth better than the afternoon high alone.
How cooling degree days connect to electricity demand
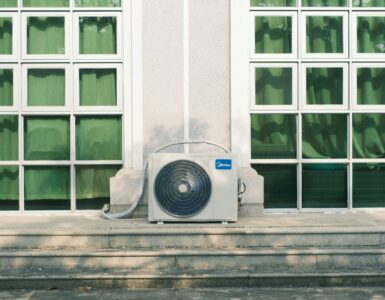
Air conditioning is one of the main reasons electricity demand rises during hot weather. When many homes, schools, stores, and offices cool at the same time, the electric grid must supply enough power for that shared load. Cooling degree days give utilities and energy analysts a rough way to connect weather patterns with demand patterns.
NOAA describes degree days as one measure of weather-related energy demand. The idea is not that every cooling degree day produces the same number of kilowatt-hours in every building. Instead, the accumulation helps show whether a period was generally more or less demanding for cooling than another period. A June with many cooling degree days is likely to create more cooling pressure than a milder June, all else equal.
The pattern also helps explain regional differences. A hot day in a densely populated city can affect total electricity demand more than the same temperature in a sparsely populated area. NOAA’s Climate Prediction Center notes that regional energy demand is often estimated with population-weighted statistics rather than simple area averages. Temperatures where many people live usually matter more for the grid than temperatures over empty land.
Cooling degree days are also useful because they can be summed. One extreme day might strain the grid, but a long stretch of above-average warmth can quietly build a larger total. Seven days with 12 cooling degree days each add up to 84 cooling degree days. That can mean a week of steady air-conditioning use, warmer buildings, and higher electricity demand even if no single day breaks a record.
Why cooling degree days do not equal your exact bill
Cooling degree days help explain the weather side of cooling demand, but they do not include every factor that appears on a utility bill. Two homes in the same neighborhood can experience the same weather and still use very different amounts of electricity. The difference may come from insulation, window quality, shade, air leaks, ceiling height, appliance use, thermostat setting, household size, or the efficiency of the cooling system.
A newer, well-sealed home with shaded windows may need far less cooling than an older home with poor insulation and full afternoon sun. A household that sets the thermostat to 78°F will usually use less cooling than one that sets it to 70°F. A heat pump or central air system with better efficiency can move more heat with less electricity than an older unit in poor condition.

Electricity rates add another layer. If a utility charges more during peak hours, a hot afternoon can cost more than the same amount of electricity used late at night. Some bills include fixed charges, delivery charges, taxes, or tiered pricing that make the final amount rise in a way that is not perfectly proportional to cooling degree days.
Humidity can also complicate the picture. Cooling degree days are based on temperature, but humid air can make a room feel uncomfortable at a lower temperature because sweat evaporates less easily. Air conditioners also remove moisture as they cool, which means a sticky day may require longer run times than temperature alone suggests. That is one reason heat index, wet-bulb temperature, and indoor humidity still matter even when cooling degree days are useful.
How planners use cooling degree days
Cooling degree days are especially helpful for comparing patterns over time. A building manager can compare this July with last July and ask how much of a higher electric bill came from hotter weather. A utility can look at seasonal forecasts and prepare for higher cooling demand. A climate researcher can study how cooling needs are shifting as summers become warmer in many places.
The calculation also helps make sense of maps and outlooks. A region with higher accumulated cooling degree days is not just a place with hot afternoons. It is a place where average temperatures spent more time above the cooling baseline. That can influence power demand, equipment stress, household budgets, and planning for future buildings.
There is a practical lesson for everyday readers too. The comfort of a home depends on the whole pattern of heat, not only the day’s headline high. Warm nights, repeated hot days, direct sun, and poor airflow can keep indoor spaces from recovering. When the cooling degree day total rises, it signals that cooling systems may be working more often and for longer stretches.
The measure is simple enough to calculate by hand, but its value is bigger than the arithmetic. It connects the weather report to the energy systems behind daily life. It shows why a summer month can feel expensive even without one historic heat wave, why cities care about overnight lows, and why utilities watch temperature forecasts so closely.
Reading the number wisely
Cooling degree days are best understood as a weather pressure gauge. A higher number means the outside temperature created more likely need for cooling. It does not prove exactly how much electricity one home used, and it does not measure personal heat safety by itself. It is one piece of a larger picture.
Used wisely, though, the number is powerful. It turns scattered daily temperatures into a pattern that can be compared, summed, and planned around. The next time a hot week sends air conditioners running across a city, cooling degree days can explain why the grid feels the strain and why the bill may look different even before anyone changes a thermostat.
Summer heat is not only a matter of how hot the hottest hour becomes. It is also about how long warmth lingers, how little the night cools down, and how many days in a row buildings must fight the same upward push. Cooling degree days give that accumulated pressure a name.


Add comment