Aurora forecasts can look simple at first: a number goes up, a green oval moves south, and people start asking whether the northern lights might appear from their backyard. The reality is more interesting. The number most people notice, the Kp index, is a useful shortcut for geomagnetic activity, but it is not a promise that a particular sky will glow at a particular hour.
Learning how to read Kp makes aurora forecasts less mysterious. It helps explain why the same forecast can be exciting in northern Minnesota, ordinary in northern Canada, and meaningless under a cloudy city sky. It also shows why a forecast map from NOAA’s Space Weather Prediction Center is more than a pretty green band across the globe. It is a model of how energy from the Sun is disturbing Earth’s magnetic environment.
What the Kp Index Measures
The Kp index is a planetary measure of geomagnetic activity. In plain language, it describes how disturbed Earth’s magnetic field is over a three-hour period. The scale runs from 0 to 9, with low values showing quiet conditions and higher values showing stronger magnetic disturbance. NOAA’s Space Weather Prediction Center treats Kp 5 and above as geomagnetic storm conditions, matching those levels to the familiar G-scale used in space-weather alerts.
The letter K comes from an older system used by individual magnetic observatories. Those observatories measure changes in the horizontal component of Earth’s magnetic field using magnetometers. Because one station can be affected by local conditions, the planetary Kp value standardizes readings from several observatories so forecasters and researchers can describe global geomagnetic activity in one number.
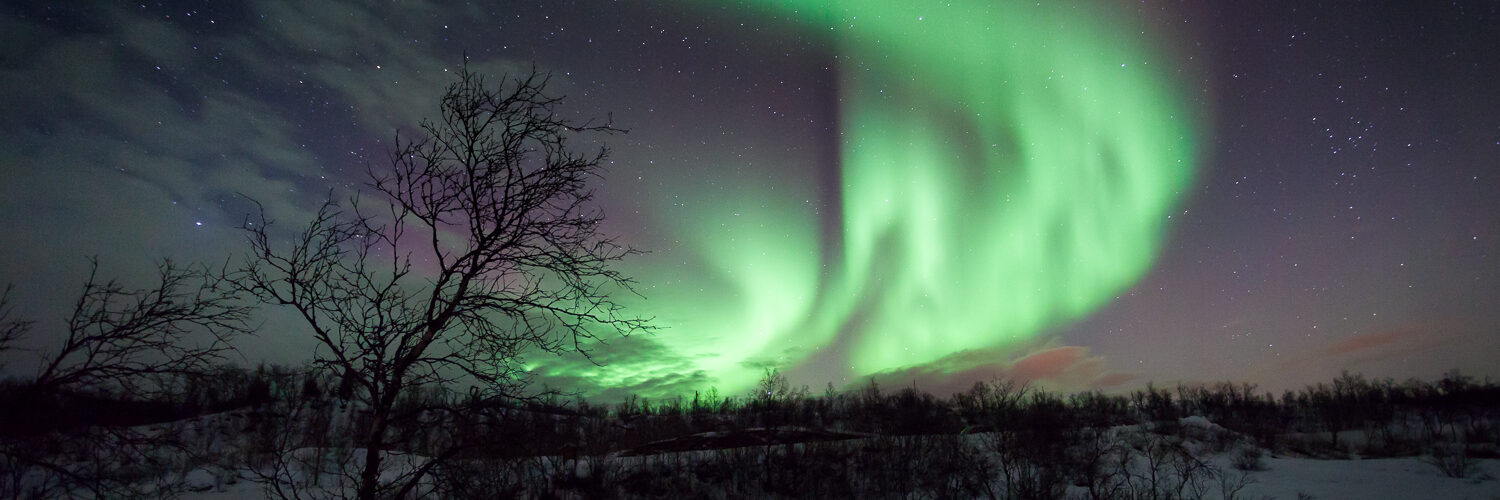
That number is useful because auroras are tied to disturbances in the magnetosphere, the region around Earth shaped by the planet’s magnetic field. When the solar wind carries energy and magnetic structure from the Sun toward Earth, some of that energy can enter the magnetosphere. Charged particles are then guided along magnetic field lines toward the upper atmosphere, where they collide with oxygen and nitrogen and release light. The stronger the disturbance, the farther the auroral oval can expand away from the poles.
Why Kp Changes Where Auroras May Be Visible
Under quiet conditions, auroras usually stay close to the polar regions. A low Kp value does not mean there is no aurora anywhere; it often means the visible activity is confined to higher latitudes. That is why places in Alaska, northern Canada, Scandinavia, Iceland, and similar latitudes can see auroras when people farther south see nothing.
As Kp rises, the auroral oval can grow brighter and expand toward lower latitudes. A Kp of 5, which corresponds to a minor geomagnetic storm on NOAA’s G-scale, may bring aurora chances to some northern U.S. states if skies are dark and clear. Higher values can push the viewing zone farther south, though the exact boundary depends on more than the number. The shape of Earth’s magnetic field, the timing of the storm, the strength of the solar wind, and the direction of the interplanetary magnetic field all matter.
One useful habit is to think of Kp as a regional clue rather than a local forecast. It tells you the overall magnetic disturbance is strong enough to make auroras possible across a wider zone. It does not tell you whether clouds will clear, whether twilight will be too bright, whether city lights will wash out a faint glow, or whether the strongest burst will arrive while you are asleep.
How NOAA Forecast Maps Use Kp
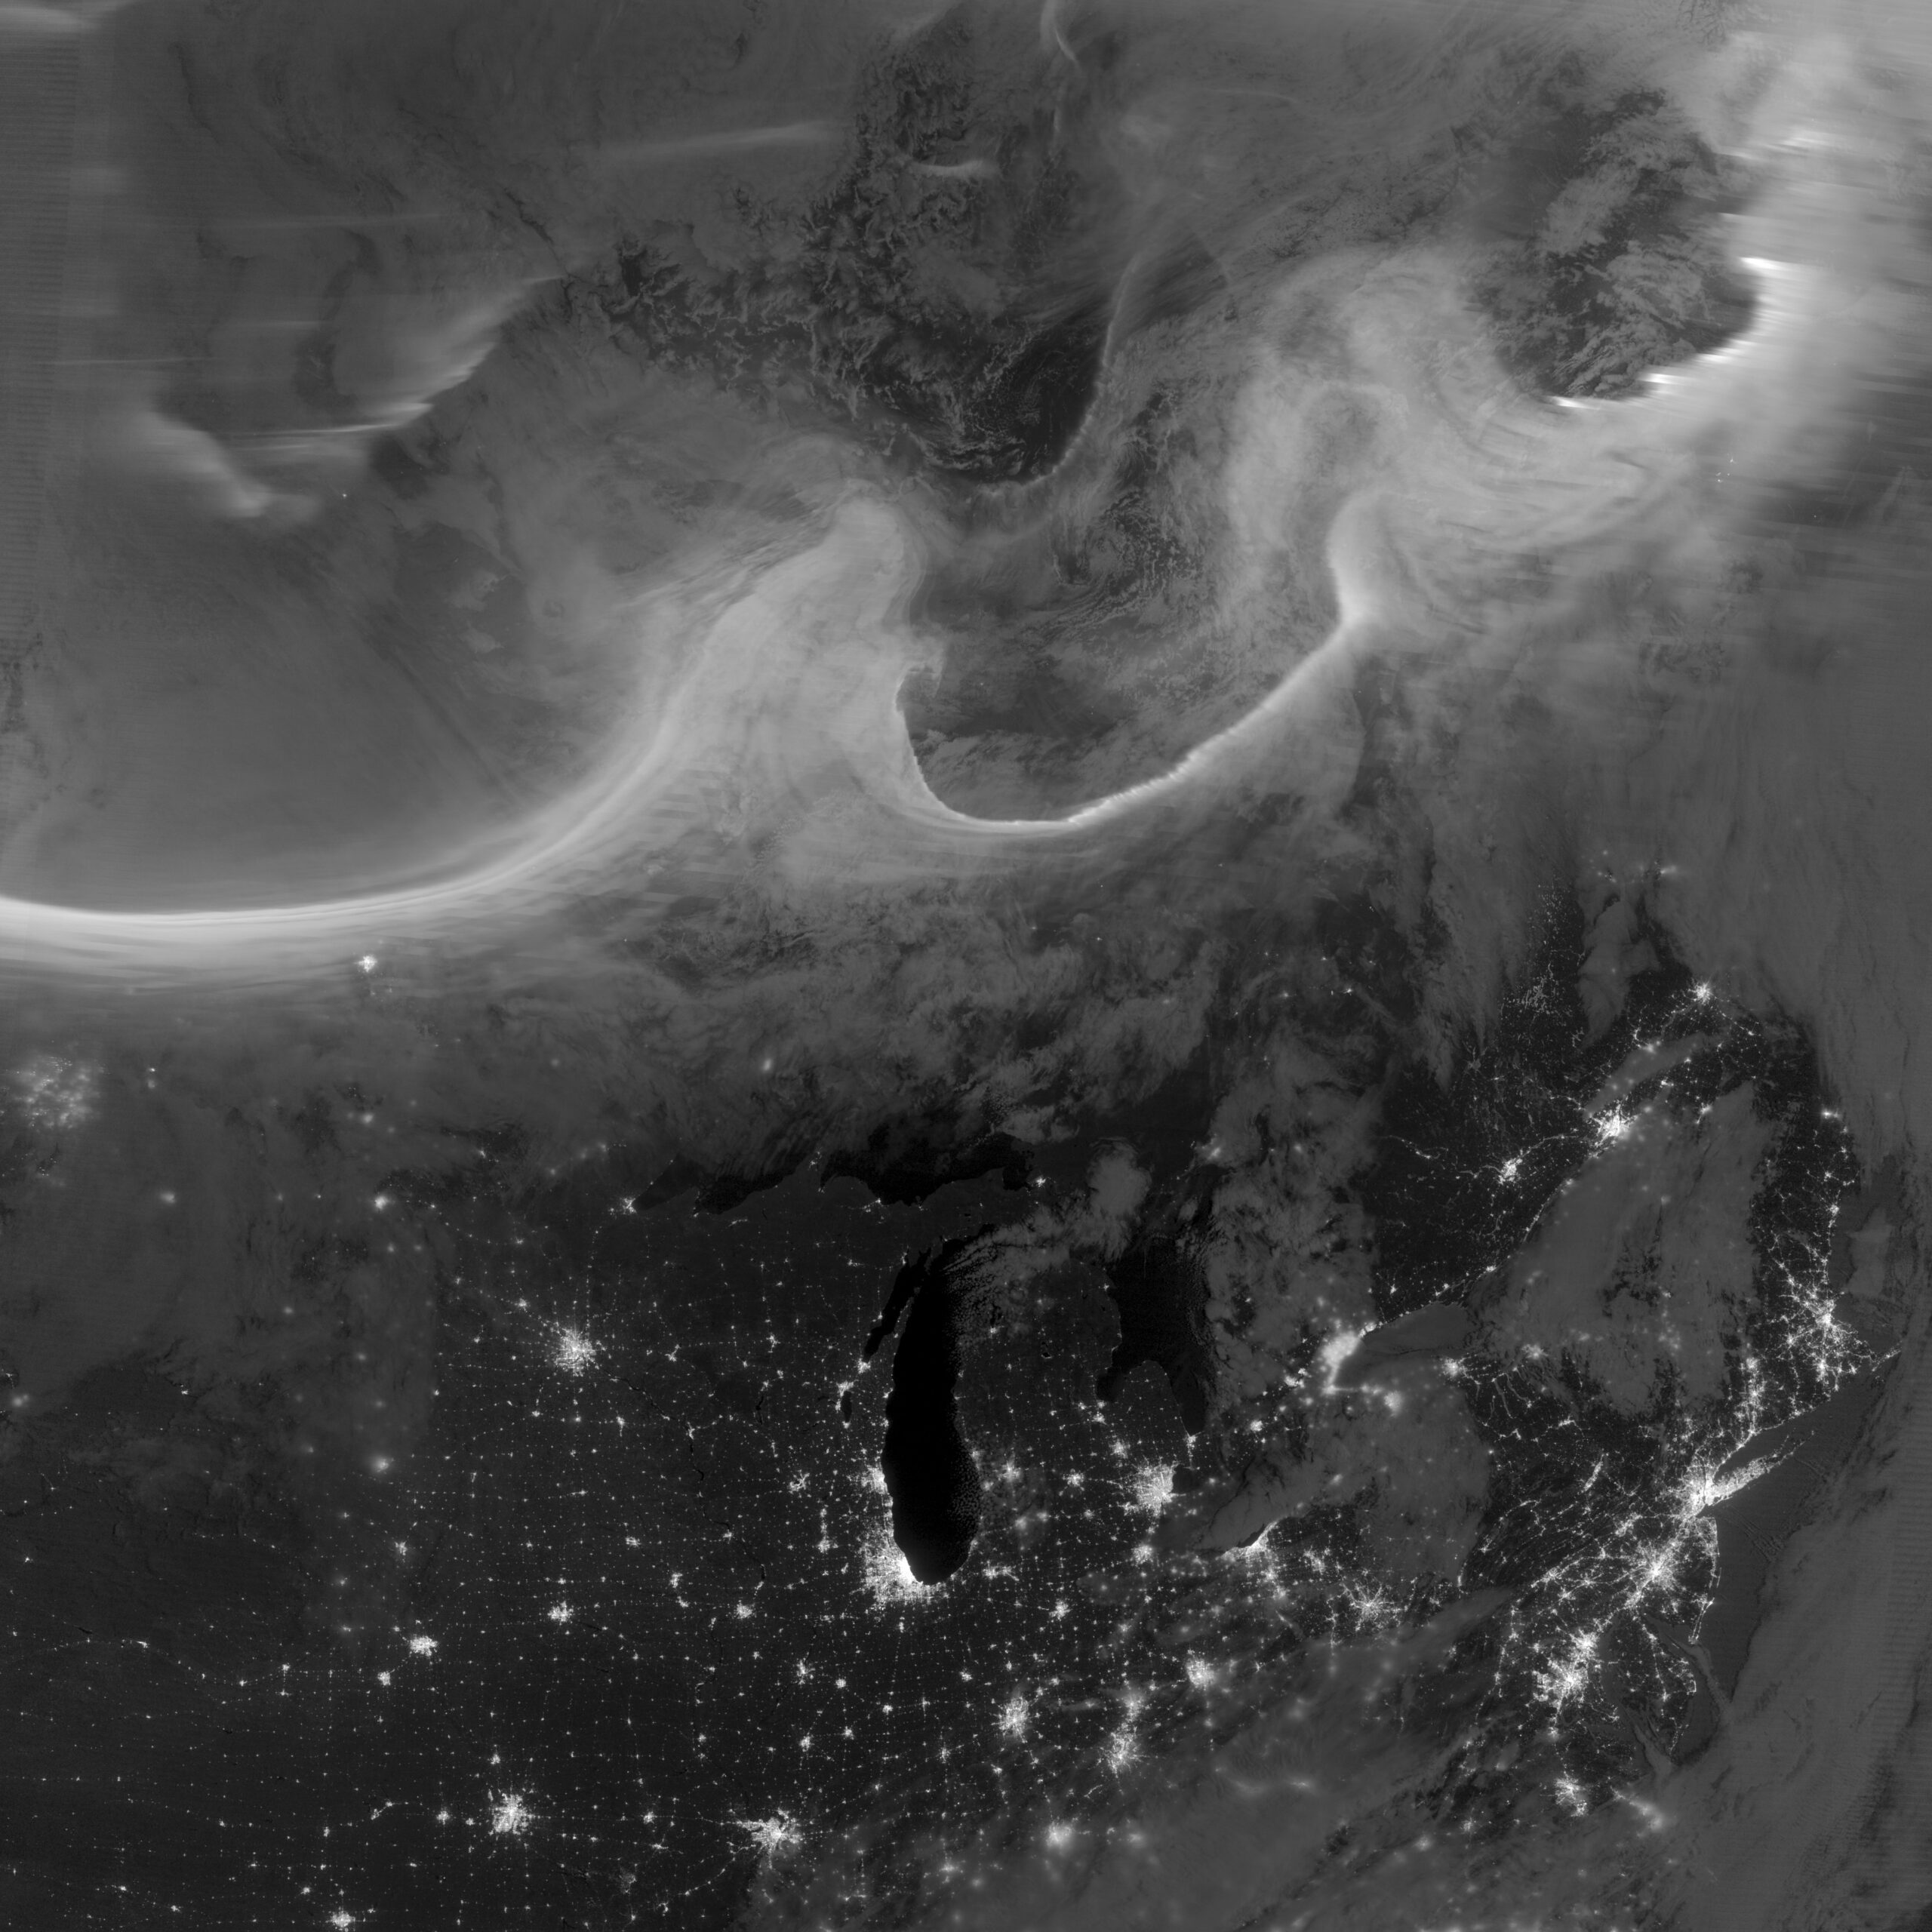
NOAA’s aurora products combine measurements and models to translate space-weather conditions into visual forecast maps. The short-term 30-minute forecast uses the OVATION model, which estimates the location and intensity of the aurora from solar wind conditions measured upstream from Earth, near the L1 observation point. That lead time exists because the solar wind still has to travel from the spacecraft’s location to Earth.
The tonight-and-tomorrow aurora outlook works differently. NOAA explains that this product uses the maximum forecast geomagnetic activity, expressed through Kp, for the overnight period. The model then shows where the auroral oval is expected to be and how intense it may become. On these maps, a brighter or more expanded oval means a better chance that aurora could be visible somewhere under that zone or even from some distance away, if the aurora is bright enough and the viewing conditions cooperate.
This is why forecast maps can change quickly. A coronal mass ejection, a high-speed solar wind stream from a coronal hole, or a shift in the solar wind’s magnetic direction can alter conditions faster than a casual skywatcher expects. Kp forecasts are valuable, but they are forecasts of a changing system, not fixed appointments.
Common Mistakes When Reading Aurora Forecasts
The first mistake is treating Kp as if it were a brightness setting. A higher Kp usually improves the odds of wider aurora visibility, but it does not guarantee a vivid overhead display. Sometimes a high-latitude observer sees active aurora during moderate conditions, while a lower-latitude observer sees only a faint gray-green glow during a stronger storm.
The second mistake is ignoring local darkness. Auroras compete with sunlight, twilight, moonlight, clouds, haze, and artificial lighting. A forecast that looks promising at 2 p.m. is not useful until the sky is dark. In summer at high northern latitudes, long twilight can make viewing difficult even when geomagnetic activity is elevated. In cities, a faint aurora may be present but invisible to the eye because streetlights brighten the sky.
The third mistake is looking only at a daily maximum. Kp is reported in three-hour intervals, and auroras can pulse, fade, and brighten within a night. A forecast that lists a promising maximum may still concentrate the best activity during one part of the night. Checking the time window matters, especially because many space-weather products use Coordinated Universal Time rather than local time.
A Practical Way to Read an Aurora Forecast
Start with the Kp forecast to judge whether the magnetic disturbance is likely to be quiet, unsettled, or stormy. If Kp stays below 4, lower-latitude viewing is usually unlikely, though high-latitude places may still have chances. If Kp reaches 5 or higher, check the G-scale wording and the forecast map to see how far the auroral oval is expected to expand.
Next, compare the map with your latitude and your northern horizon. Many people do not need the aurora directly overhead. NOAA notes that bright aurora can sometimes be observed from far away when conditions are right, so a clear view toward the poleward horizon can matter. For observers in the Northern Hemisphere, that usually means looking north from a dark location away from bright town centers.
Then check the ordinary weather. Cloud cover can erase the best space-weather setup, while a crisp, dark, transparent sky can make a modest aurora easier to notice. Moon phase matters too. A bright Moon does not always ruin aurora watching, especially during strong storms, but it can make faint structure harder to see.
Finally, watch for updates. The 30-minute forecast, recent Kp observations, and short-term space-weather alerts can be more useful than a forecast checked many hours earlier. The Sun does not send neatly scheduled events, and Earth does not receive them with perfect predictability. Good aurora watching blends planning with patience.
Why the Kp Index Is Useful Even When You Do Not See Lights
Kp is not only for people hoping to photograph the northern lights. Geomagnetic storms can affect radio communication, satellite operations, GPS accuracy, and power-grid systems. That is why NOAA uses Kp and related measures to issue watches, warnings, and alerts for people who manage technology as well as for observers who want to understand the sky.
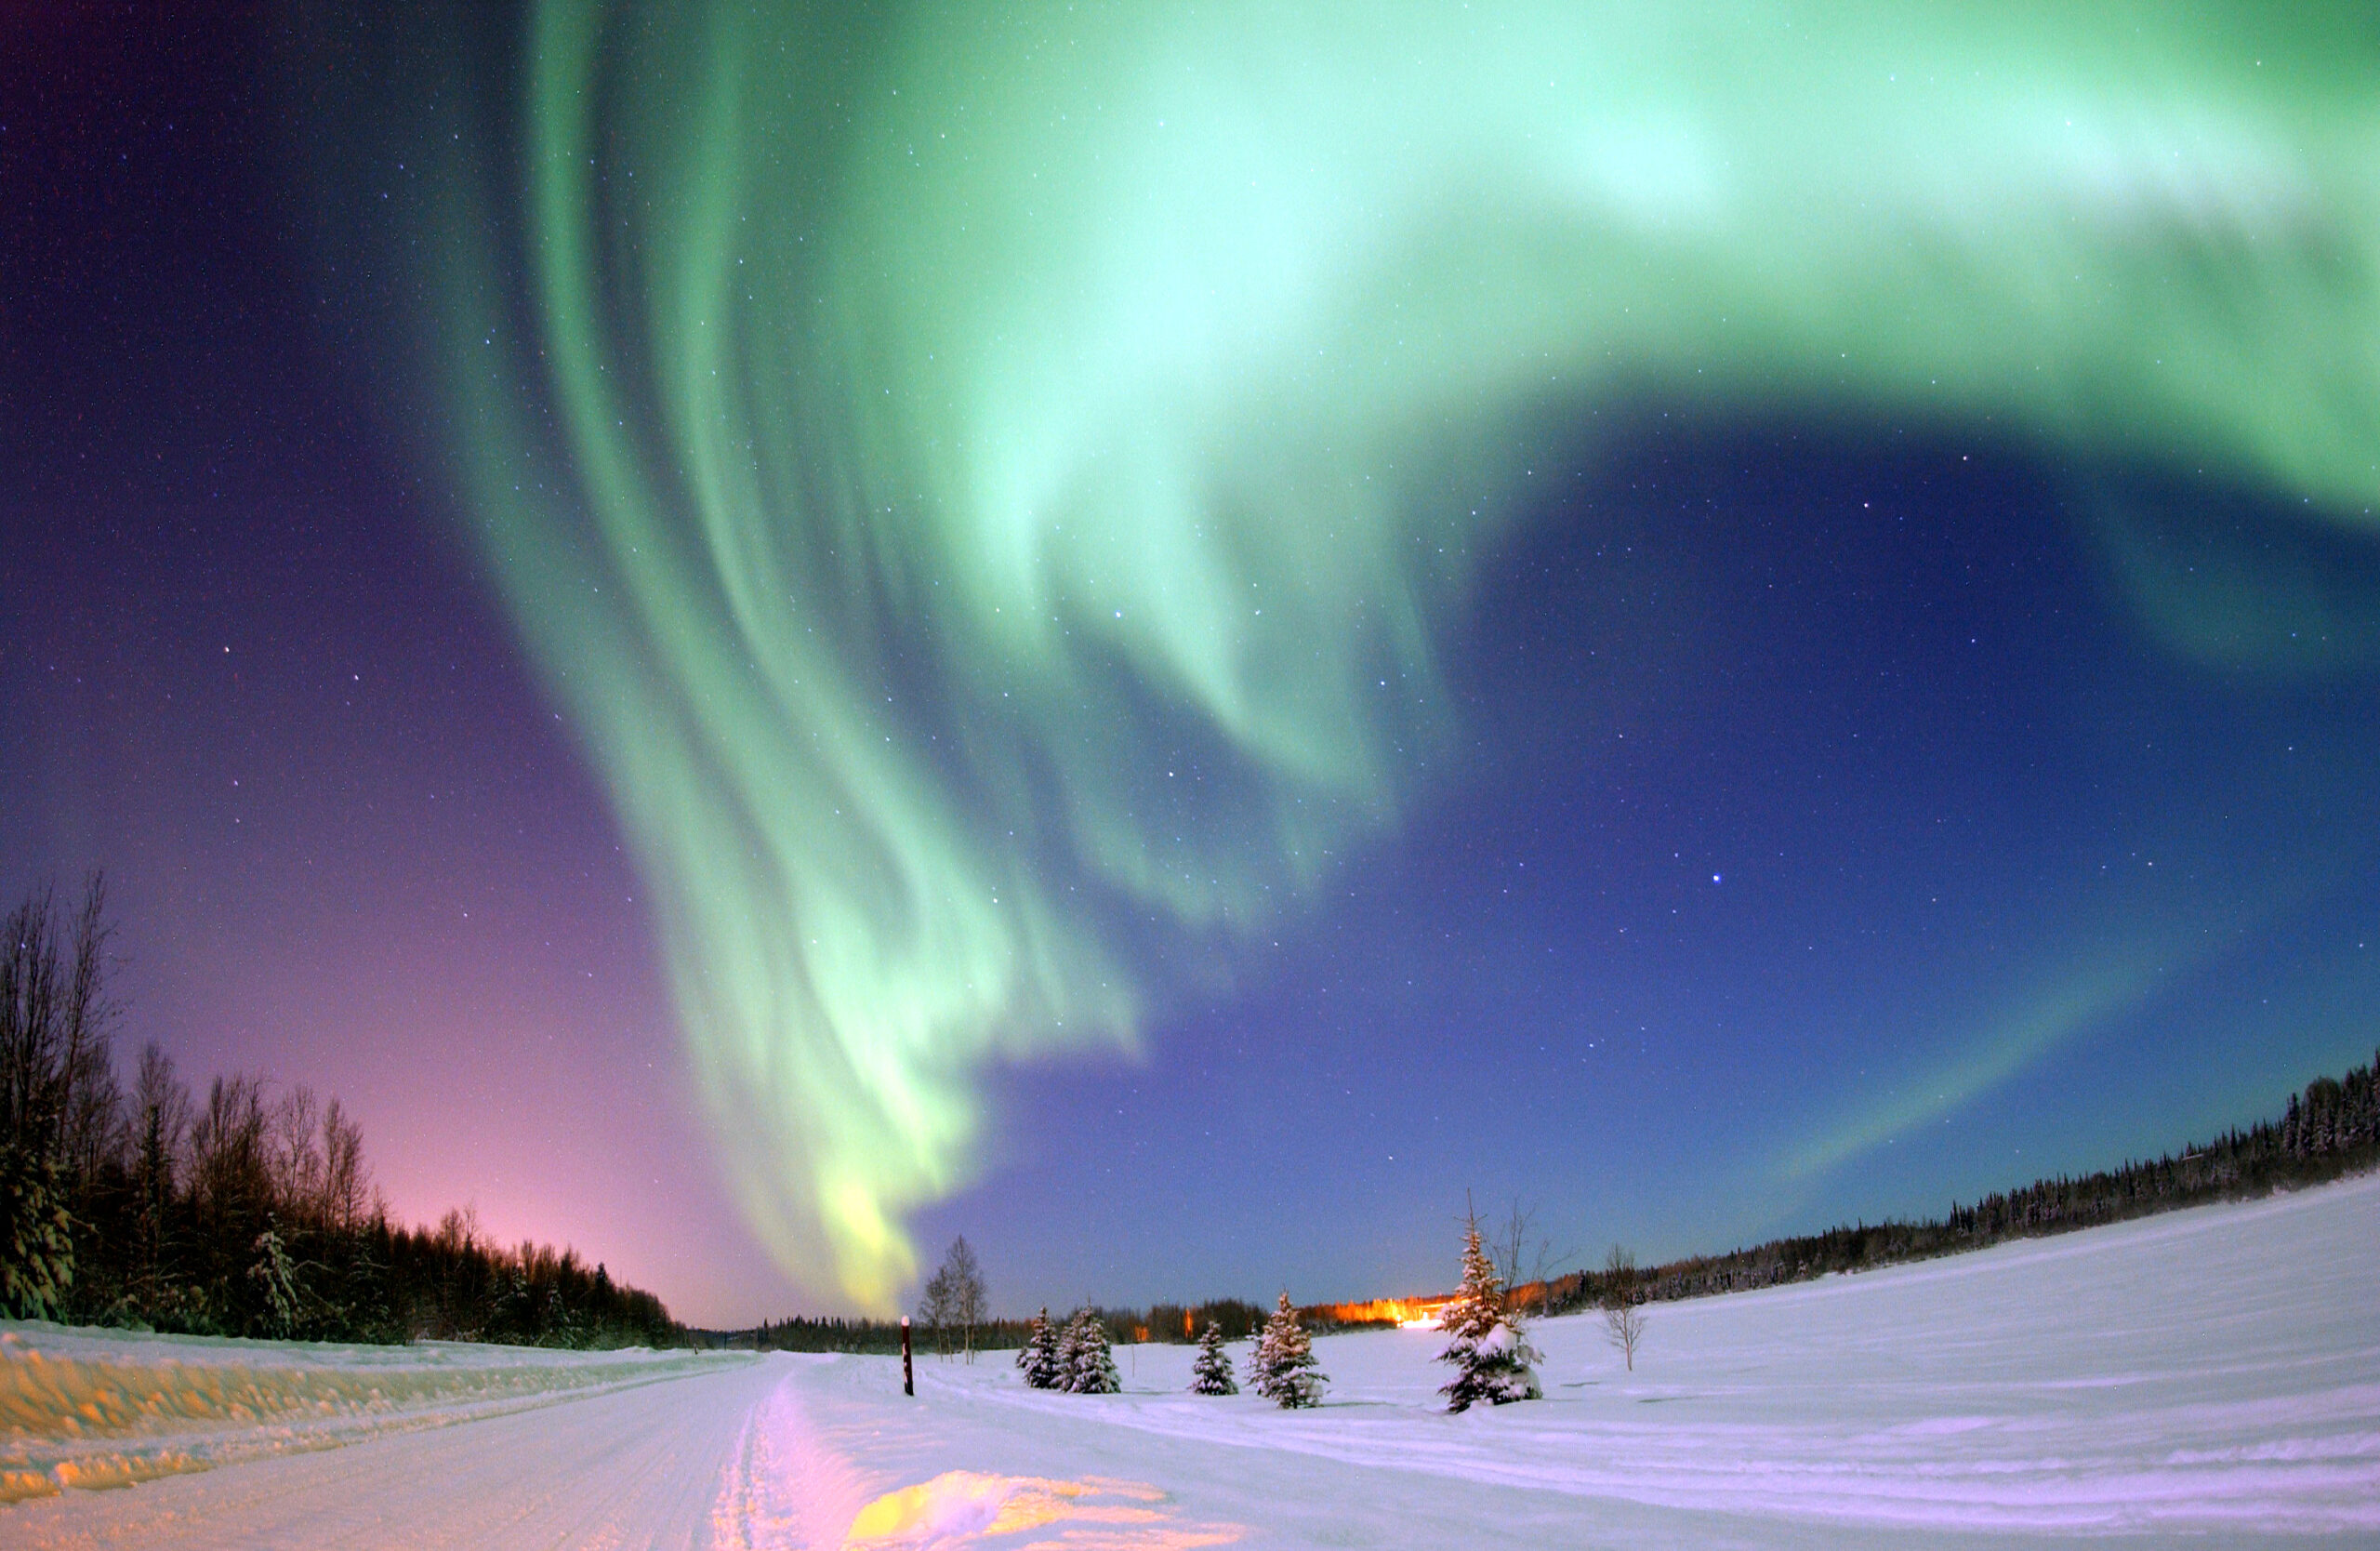
For learners, the Kp index is a compact way to connect everyday skywatching with a much larger system. A number on a forecast page carries information from magnetometers on Earth, solar wind measurements in space, and models of the auroral oval. It links the Sun, the magnetosphere, the upper atmosphere, and the view from a dark road or frozen lake.
The best way to use Kp is neither to ignore it nor to treat it as magic. It is a strong first clue. Pair it with forecast maps, time windows, local weather, and dark-sky conditions, and aurora forecasts become much easier to read. Even on nights when the lights do not appear, the forecast is still showing something real: Earth responding to weather from the Sun.


Add comment