Akshay Dinesh
A road cut, a riverbank, and a rocky hillside may look like separate pieces of scenery. To a geologist, they are windows into a much larger structure that continues beneath soil, streets, forests, and buildings. A geologic map connects those scattered exposures into a reasoned picture of the ground below. Its colors and symbols do not simply mark places; they record rock type, age, orientation, and the events that shaped a landscape.
That makes a geologic map different from the map used to find a trail or measure elevation. It is a model built from field observations, laboratory work, drilling records, aerial images, and other evidence. Some boundaries are visible and precisely located. Others are inferred between observation points. Learning to tell the difference is the key to reading the map honestly: it shows both what geologists know and where uncertainty remains.
Topographic maps and geologic maps answer different questions
A topographic map describes the shape of the land surface. Contour lines join points of equal elevation, so their spacing reveals steep slopes, broad valleys, ridges, and flat ground. Roads, streams, buildings, and place names help a reader locate features. A geologic map often uses that same geographic base, but adds another layer of information: the materials and structures at or near the surface.
The U.S. Geological Survey defines geologic maps as combinations of colors, lines, and symbols that show the composition and structure of Earth materials and their distribution across and beneath the surface. They may identify bedrock formations such as sandstone, limestone, granite, or volcanic rock. They can also show younger surface deposits, including river sediment, glacial material, landslide debris, or windblown sand. A single map may therefore contain rocks hundreds of millions of years old beside sediment deposited during a recent flood.
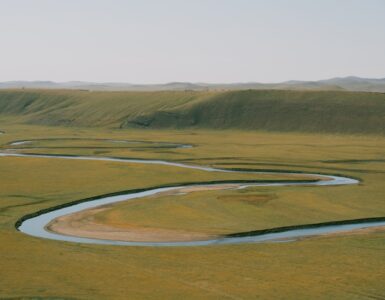
Imagine a green valley bordered by two ridges. A topographic map shows the valley’s form. A geologic map may reveal that easily eroded shale lies beneath the low ground while harder sandstone supports the ridges. The landscape and the underlying geology are related, but they are not the same thing. Elevation tells you where the ground is; geology helps explain why the ground developed that shape and what may continue beneath it.
Colors represent map units, not the color of the ground
The most conspicuous parts of a geologic map are usually its colored areas. Each area represents a map unit: a body of rock or sediment that can be distinguished from neighboring material and shown at the map’s scale. A unit might be a named formation, a particular kind of volcanic rock, or a deposit such as river alluvium. The fill color is a cartographic code, not a claim that the rocks themselves are yellow, green, or purple.
Every unit has a short label tied to the legend. Letters commonly communicate age and name, although the exact system varies from map to map. A label beginning with Q often denotes Quaternary material, while other letters may refer to older geologic periods or a local formation name. The legend is therefore not an optional key to glance at after studying the colors. It is where the map explains what each unit contains, how old it is thought to be, and how it relates to other units.
Color conventions help readers compare adjacent sheets, but they are not perfectly universal. USGS standards recommend broad color families for many intervals of geologic time, yet mapmakers also adjust colors for clarity, purpose, and local consistency. Two similar shades on different maps need not represent the same rock. The label and description of map units carry the meaning; color makes the pattern easier to see.
Scale matters too. On a detailed local map, geologists may separate several thin formations that a state-scale map combines into one unit. That does not mean one map is wrong. It means each has been generalized for a different viewing distance and purpose, much as a street map shows details that disappear from a map of an entire country.
Lines and symbols show boundaries and tilted structures
Where two map units meet, the boundary is called a contact. A solid contact generally indicates that its position is well located. A dashed contact is commonly approximate, and a dotted one may be concealed beneath soil, water, or younger deposits. These line styles are a quiet but crucial part of the map: a boundary traced along a bare cliff rests on different evidence from one projected across a covered valley.
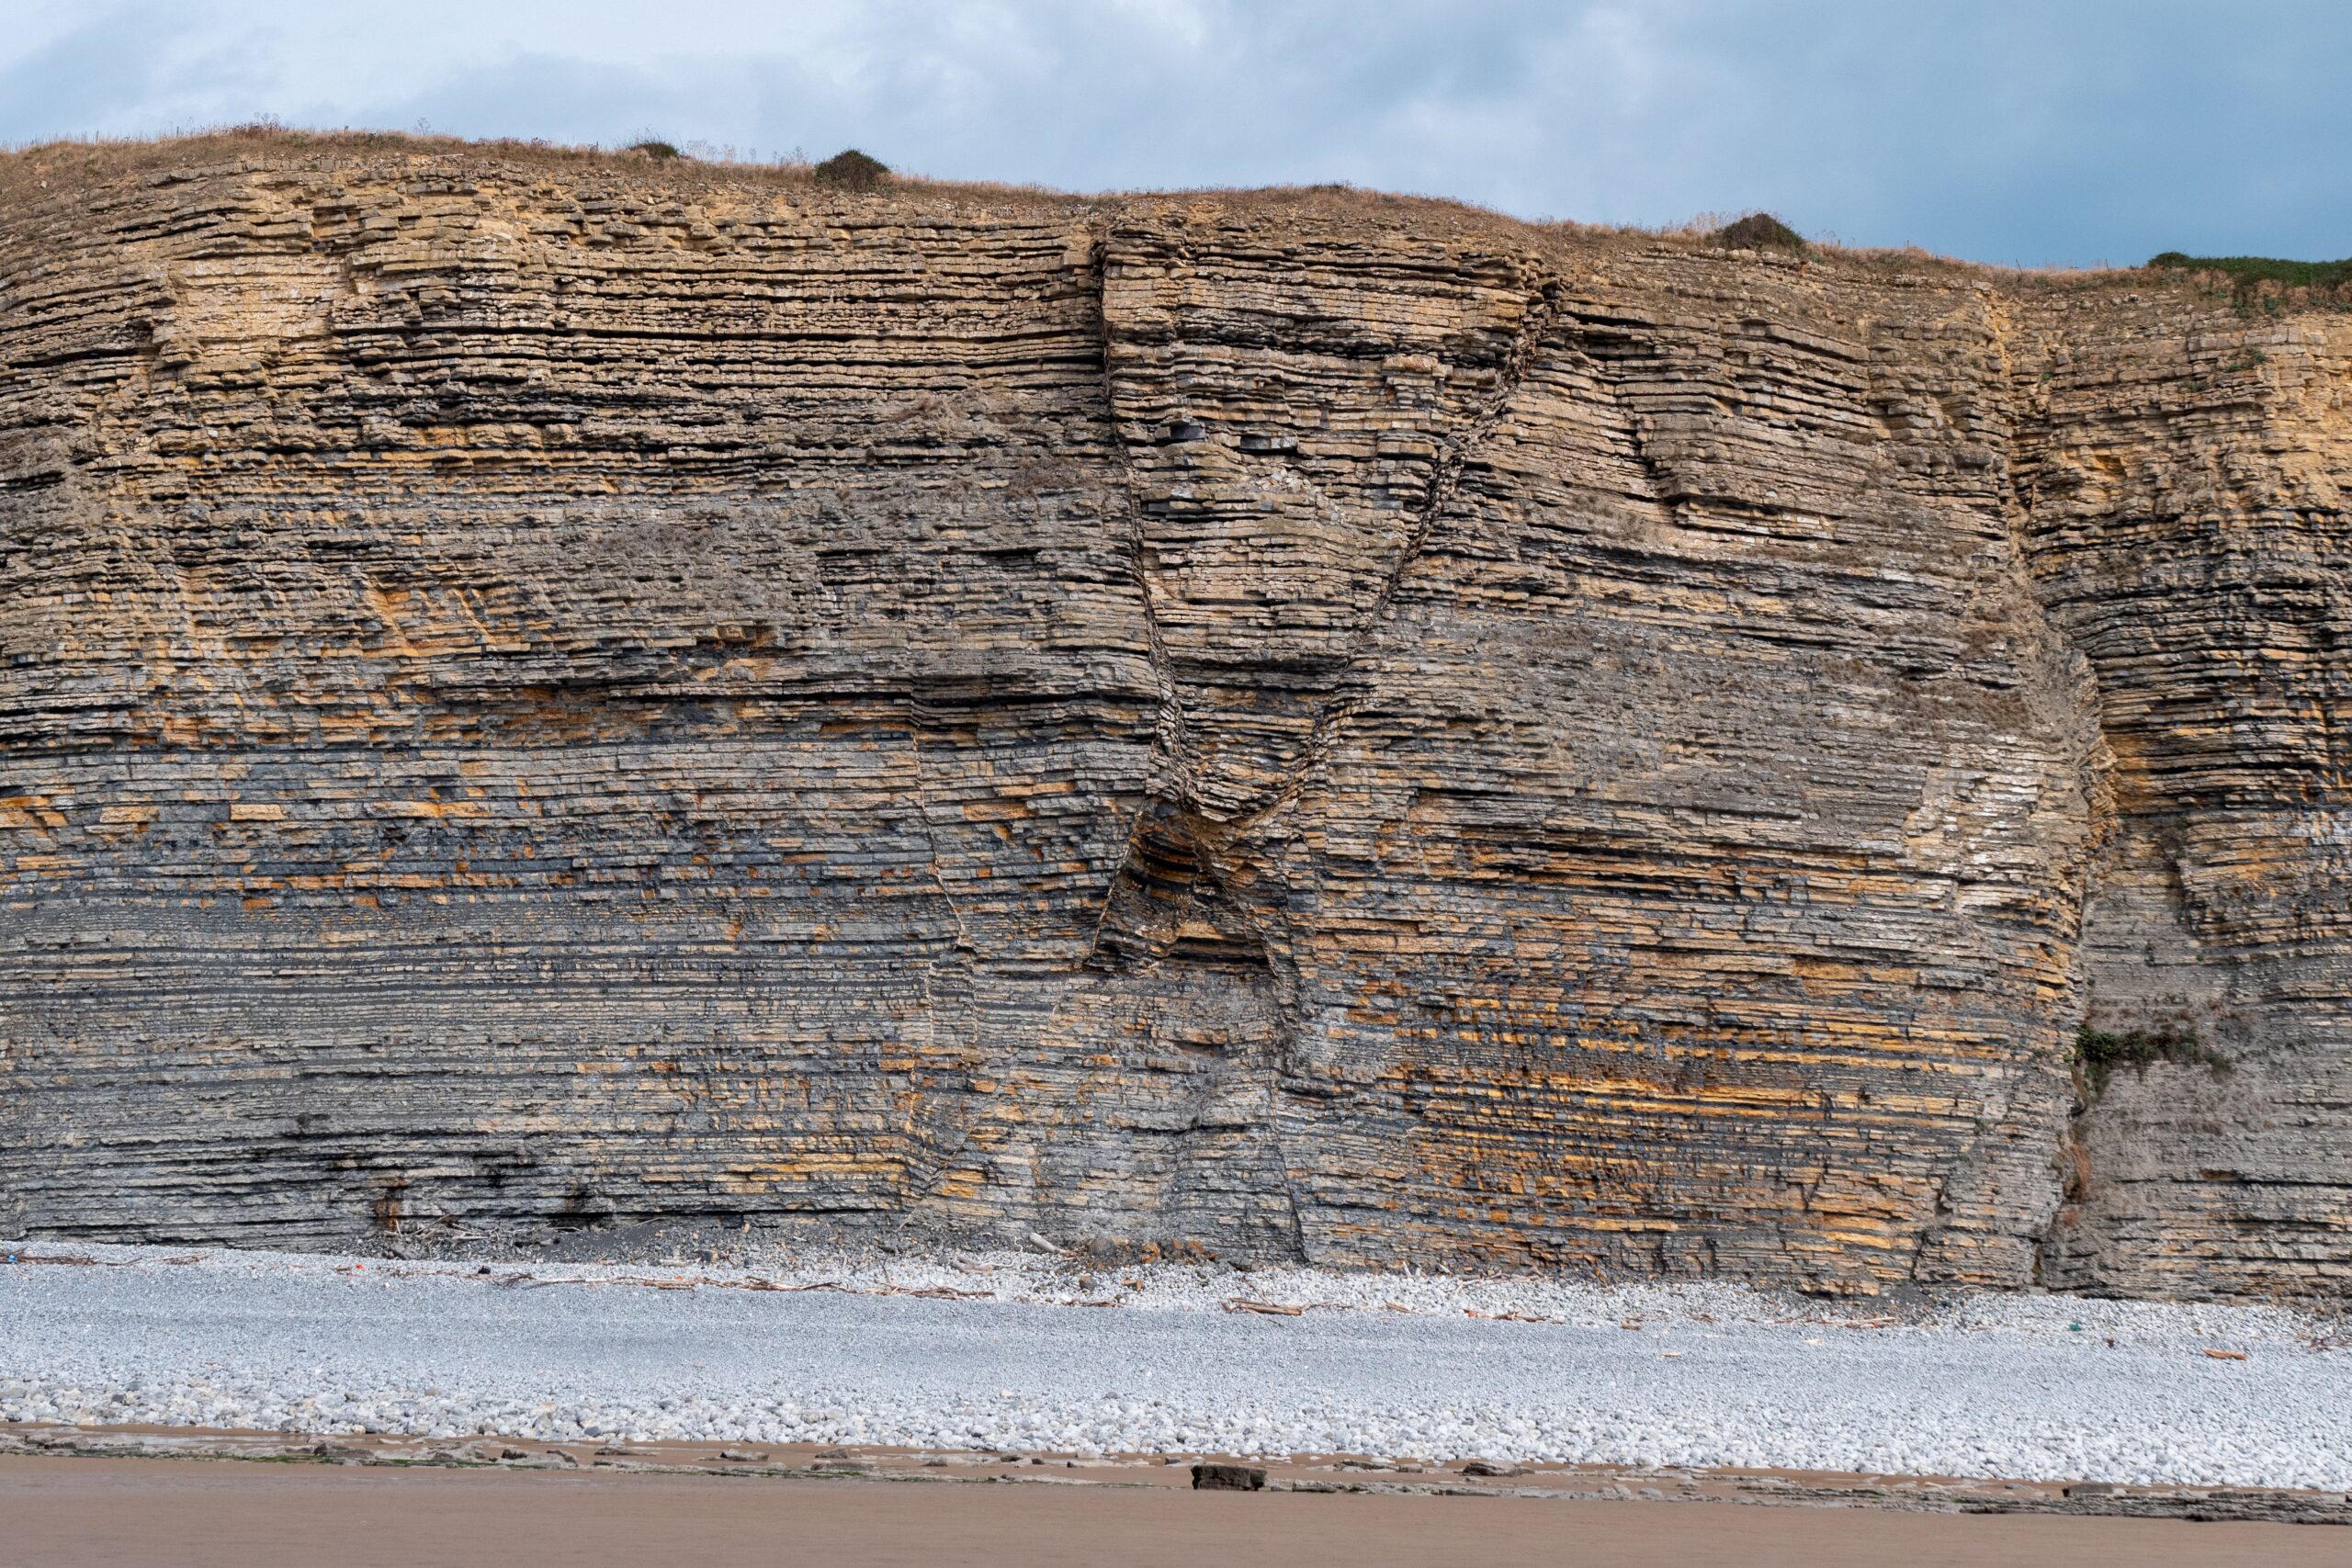
Faults receive their own line symbols because they mark fractures along which rock has moved. Teeth on one side can indicate a thrust fault, while bars, balls, arrows, or short ticks may show other kinds of motion, depending on the legend. Fold axes trace the centers of bent rock layers. When bands of the same units repeat in a roughly symmetrical pattern, the map may be showing an anticline, where layers arch upward, or a syncline, where they bend downward.
One of the most useful field symbols resembles a short capital T with a number beside it. It records strike and dip, the orientation of a planar feature such as bedding. Strike gives the compass direction of a horizontal line on that plane. Dip gives the direction and angle at which the plane slopes downward. A dip of 10 degrees describes gently inclined beds; a dip near 90 degrees describes layers standing almost vertically.
These measurements turn isolated outcrops into structural evidence. If several exposures show beds dipping toward a central line, a geologist may infer a fold even where soil hides the rock between them. If a unit ends abruptly and reappears offset on the other side of a line, a fault may explain the break. The map becomes more than an inventory of rocks: it records their three-dimensional arrangement.
Geologists build a continuous picture from incomplete evidence
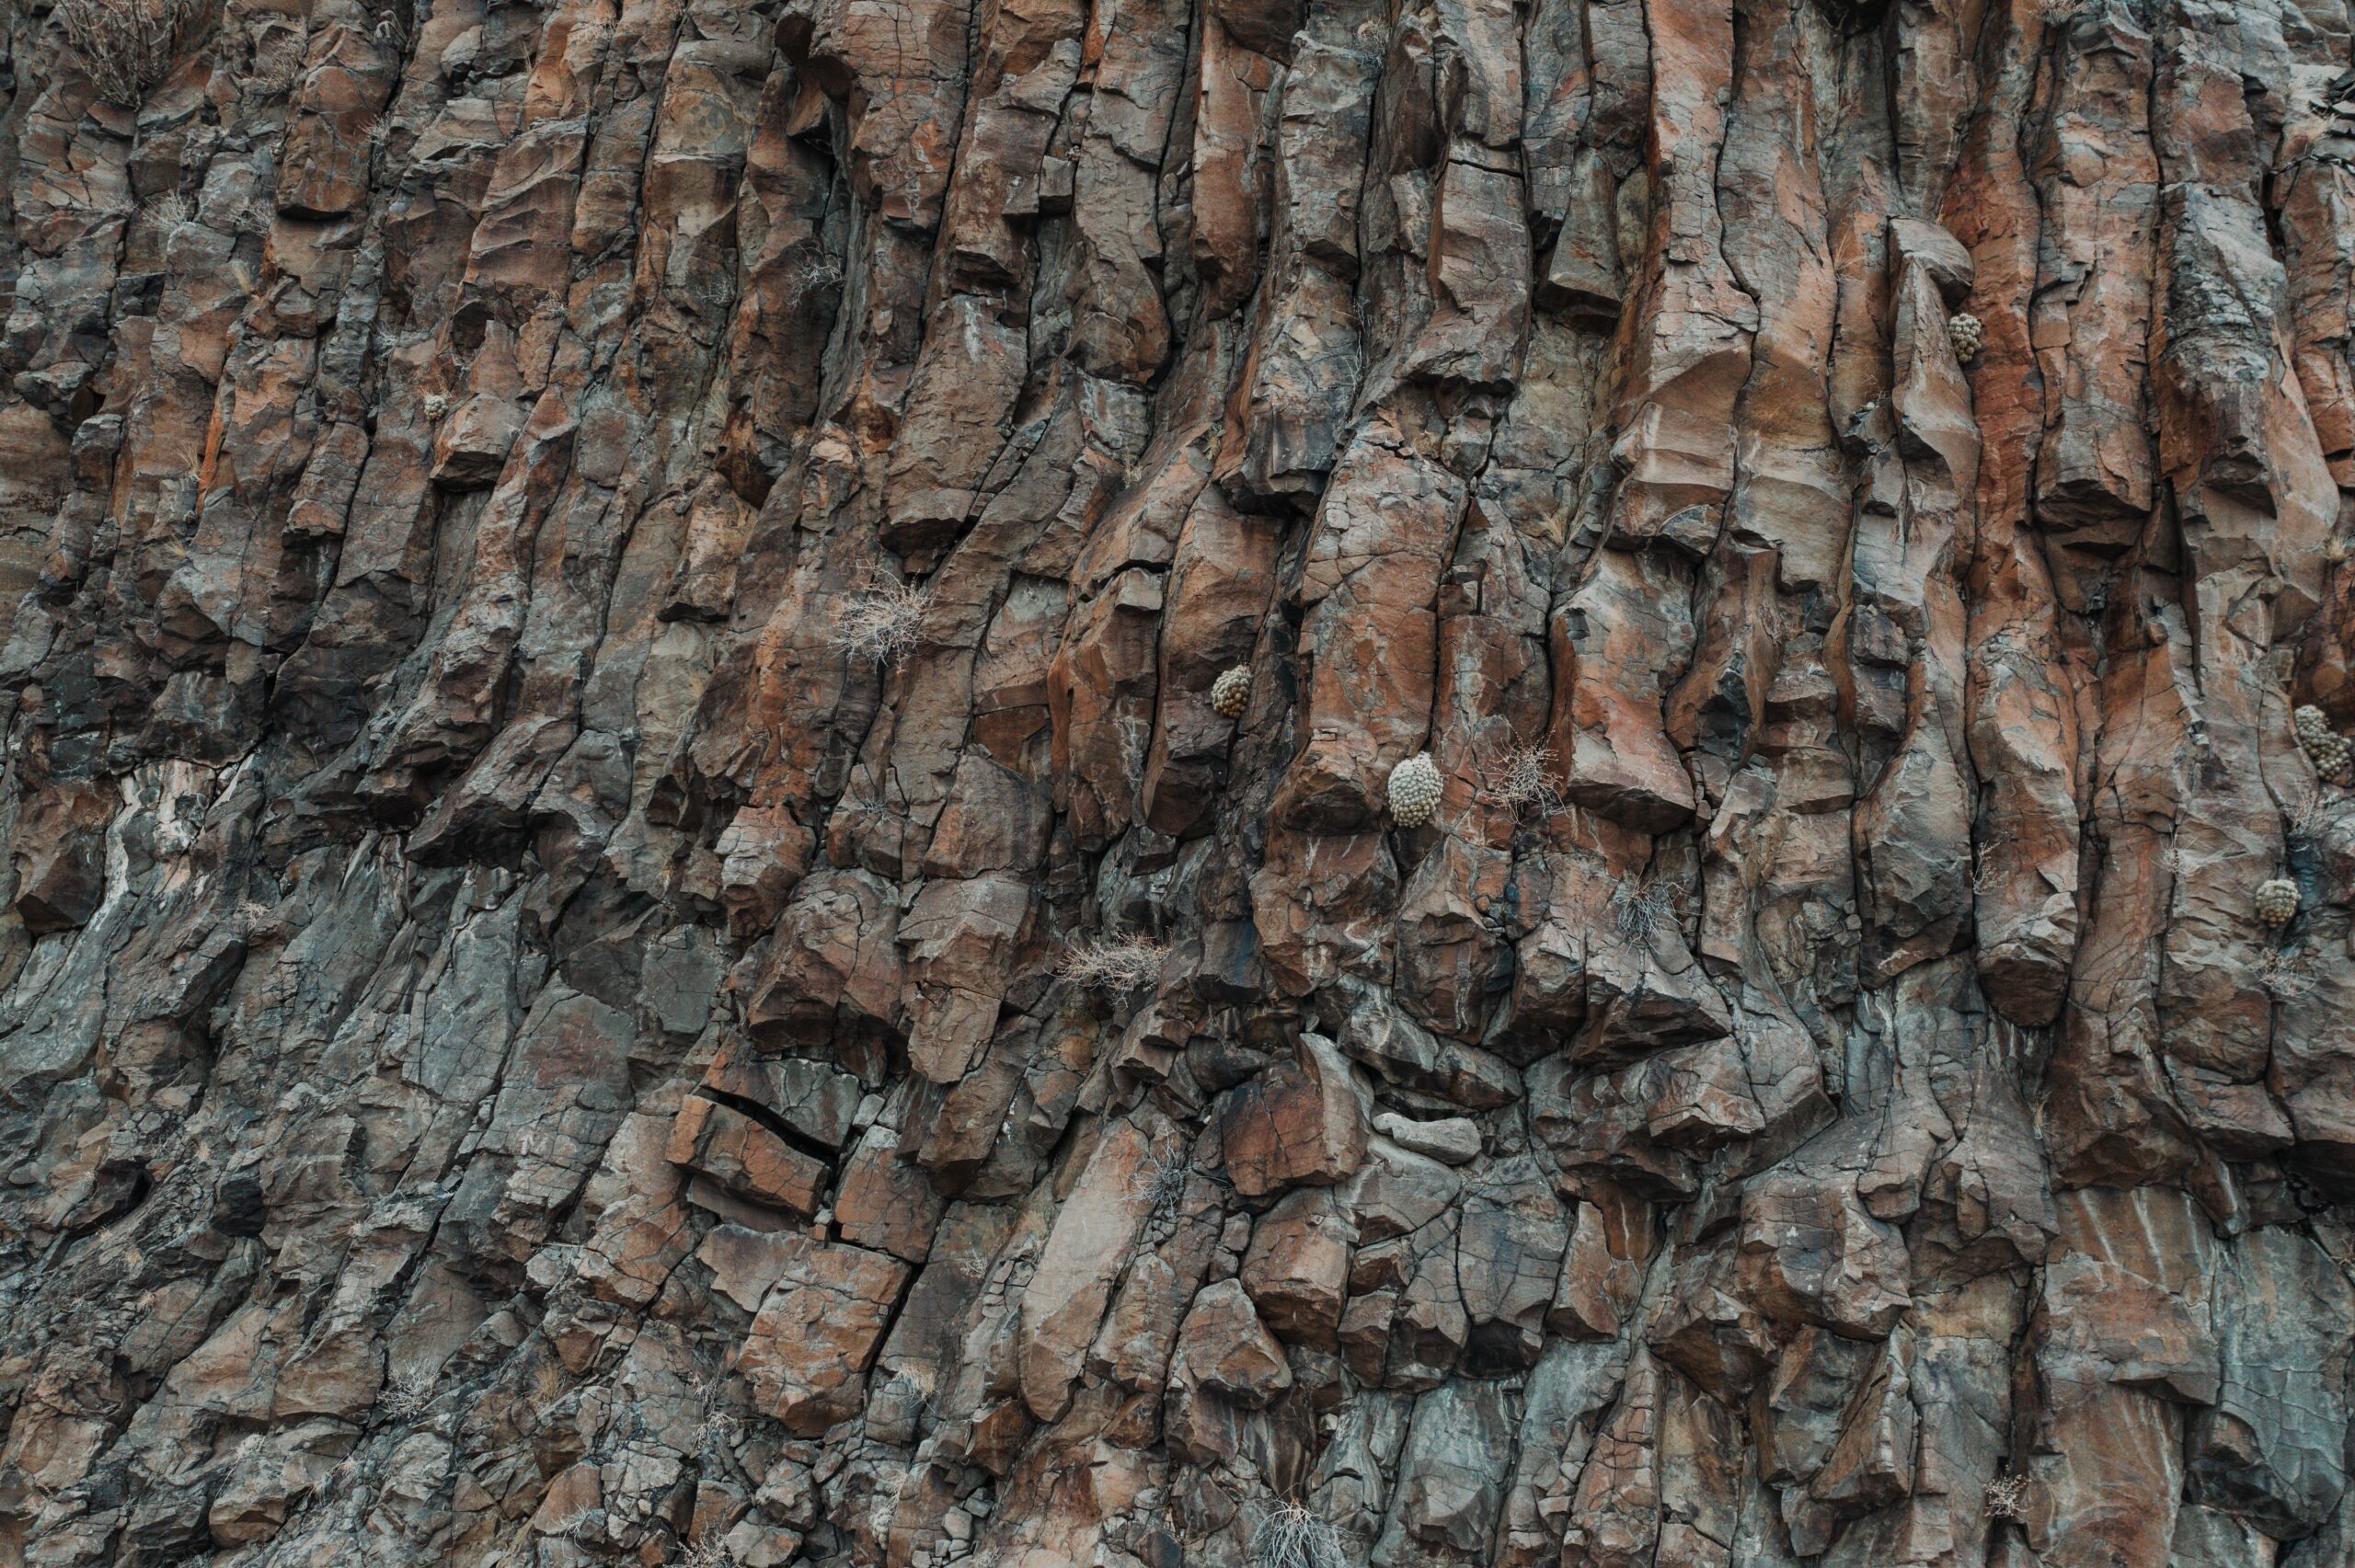
Most bedrock is hidden. Vegetation, soil, pavement, lakes, and loose sediment cover large parts of the surface, so field mapping depends on carefully chosen observations. Geologists examine cliffs, stream channels, quarries, road cuts, and natural ledges. They identify minerals and textures, measure layer orientation, note where one unit meets another, and collect samples when closer analysis is needed.
They then compare those observations with the landforms around them. A resistant unit may form a ridge; a soluble limestone may be associated with sinkholes; a soft shale may weather into a valley. Borehole logs and geophysical measurements can add information below the surface. Remote sensing and digital elevation data help trace features between field sites, but the interpretation still has to respect the evidence on the ground.
From this work, geologists draw contacts between units and decide how certain each trace is. The result is an interpretation, not a photograph with the soil removed. New exposures, drilling, better dating, or more detailed mapping can change a boundary or split one unit into several. Good maps make that provisional quality visible through their line styles, notes, sources, and publication scale.
Many map sheets include a geologic cross-section, a side view along a marked line across the map. Constructing one is like slicing through a layered cake, except the layers may be tilted, folded, eroded, repeated by faults, or intruded by molten rock. Surface contacts and strike-and-dip measurements constrain the drawing. The cross-section lets the reader test whether the proposed underground geometry fits what appears at the surface.
A careful reading can guide real decisions
Geologic maps support far more than classroom exercises. Engineers consult them when planning roads, tunnels, dams, and foundations because different materials respond differently to excavation, water, and loading. Groundwater specialists use the distribution of permeable rock, confining layers, fractures, and faults to investigate how water may move. Hazard planners look for landslide deposits, active faults, unstable volcanic material, and other features that affect where and how people build.
The same maps guide mineral exploration, soil and ecosystem studies, and land-use planning. They can help explain why radon risk varies, where a well might encounter limestone rather than shale, or why one slope fails while a nearby one remains stable. A map alone rarely settles a site-specific decision; detailed field and subsurface investigation may still be essential. Its value is that it organizes existing knowledge and helps people ask better questions before costly work begins.
When opening an unfamiliar geologic map, start with its title, location, scale, and publication date. Read the unit descriptions before trying to decode the colored pattern. Next, identify contacts, faults, fold axes, and strike-and-dip symbols, checking the legend rather than assuming every map uses identical conventions. Finally, compare the map with the topography and any cross-section: ridges, valleys, repeated units, and dipping beds should begin to form one connected story.
A geologic map is powerful precisely because it does not pretend the underground world is fully visible. It gathers many small observations, marks the confidence of the connections between them, and turns a flat surface into a testable three-dimensional history. Once its visual language becomes familiar, an ordinary landscape starts to reveal buried layers, vanished environments, and movements that took place long before the present ground took shape.