 Akshay Dinesh
Cities rarely change at the smooth, steady pace suggested by a population chart. A vacant block can become a construction site within weeks, a transit corridor can trigger several projects at once, and a nearby neighborhood may remain almost unchanged. By the time those differences appear in an annual report, the most important part of the story may already be old.
A 2026 study in the Proceedings of the National Academy of Sciences offers another way to see urban growth. Zhe Zhu, Karen Seto, and their colleagues used frequent satellite observations to build what they call an “Urban Pulse”: a neighborhood-scale record of when physical change accelerates, slows, and starts again. Their result challenges a familiar picture of urbanization. A city does not simply spread outward at one speed; its neighborhoods move through separate bursts of construction, quiet periods, and occasional decline.
A citywide average can hide the real pattern
Many standard measures of urban growth are useful but slow or broad. Population estimates can show that a metropolitan area gained residents. Building permits can show what developers intend to construct. A pair of satellite images taken years apart can reveal that farmland became streets and rooftops. Each measure captures an outcome, but none necessarily shows the timing of change within individual neighborhoods.
That timing matters because two places with the same amount of new construction can have very different histories. One may have grown gradually over a decade. The other may have changed in a short surge after a new road, zoning decision, industrial investment, or rebuilding program. If both are reduced to the same net change, planners lose clues about how quickly services and infrastructure may need to respond.
A citywide total creates another problem: local booms and slowdowns can cancel each other out. Rapid building on the edge of a city may occur at the same time as demolition or stagnation closer to the center. The average can look calm even while particular neighborhoods are being transformed. The Urban Pulse was designed to preserve those local differences and place them on a timeline.
How satellite images become a pulse
The research relies on Harmonized Landsat and Sentinel-2 data, usually shortened to HLS. Landsat is a joint NASA and U.S. Geological Survey program, while Sentinel-2 belongs to the European Union’s Copernicus Earth-observation program. The two satellite systems use different instruments and schedules, so the HLS project adjusts their observations into a more consistent record. Combined, they can provide a new view of the same land roughly every two to three days when clouds do not block the surface.
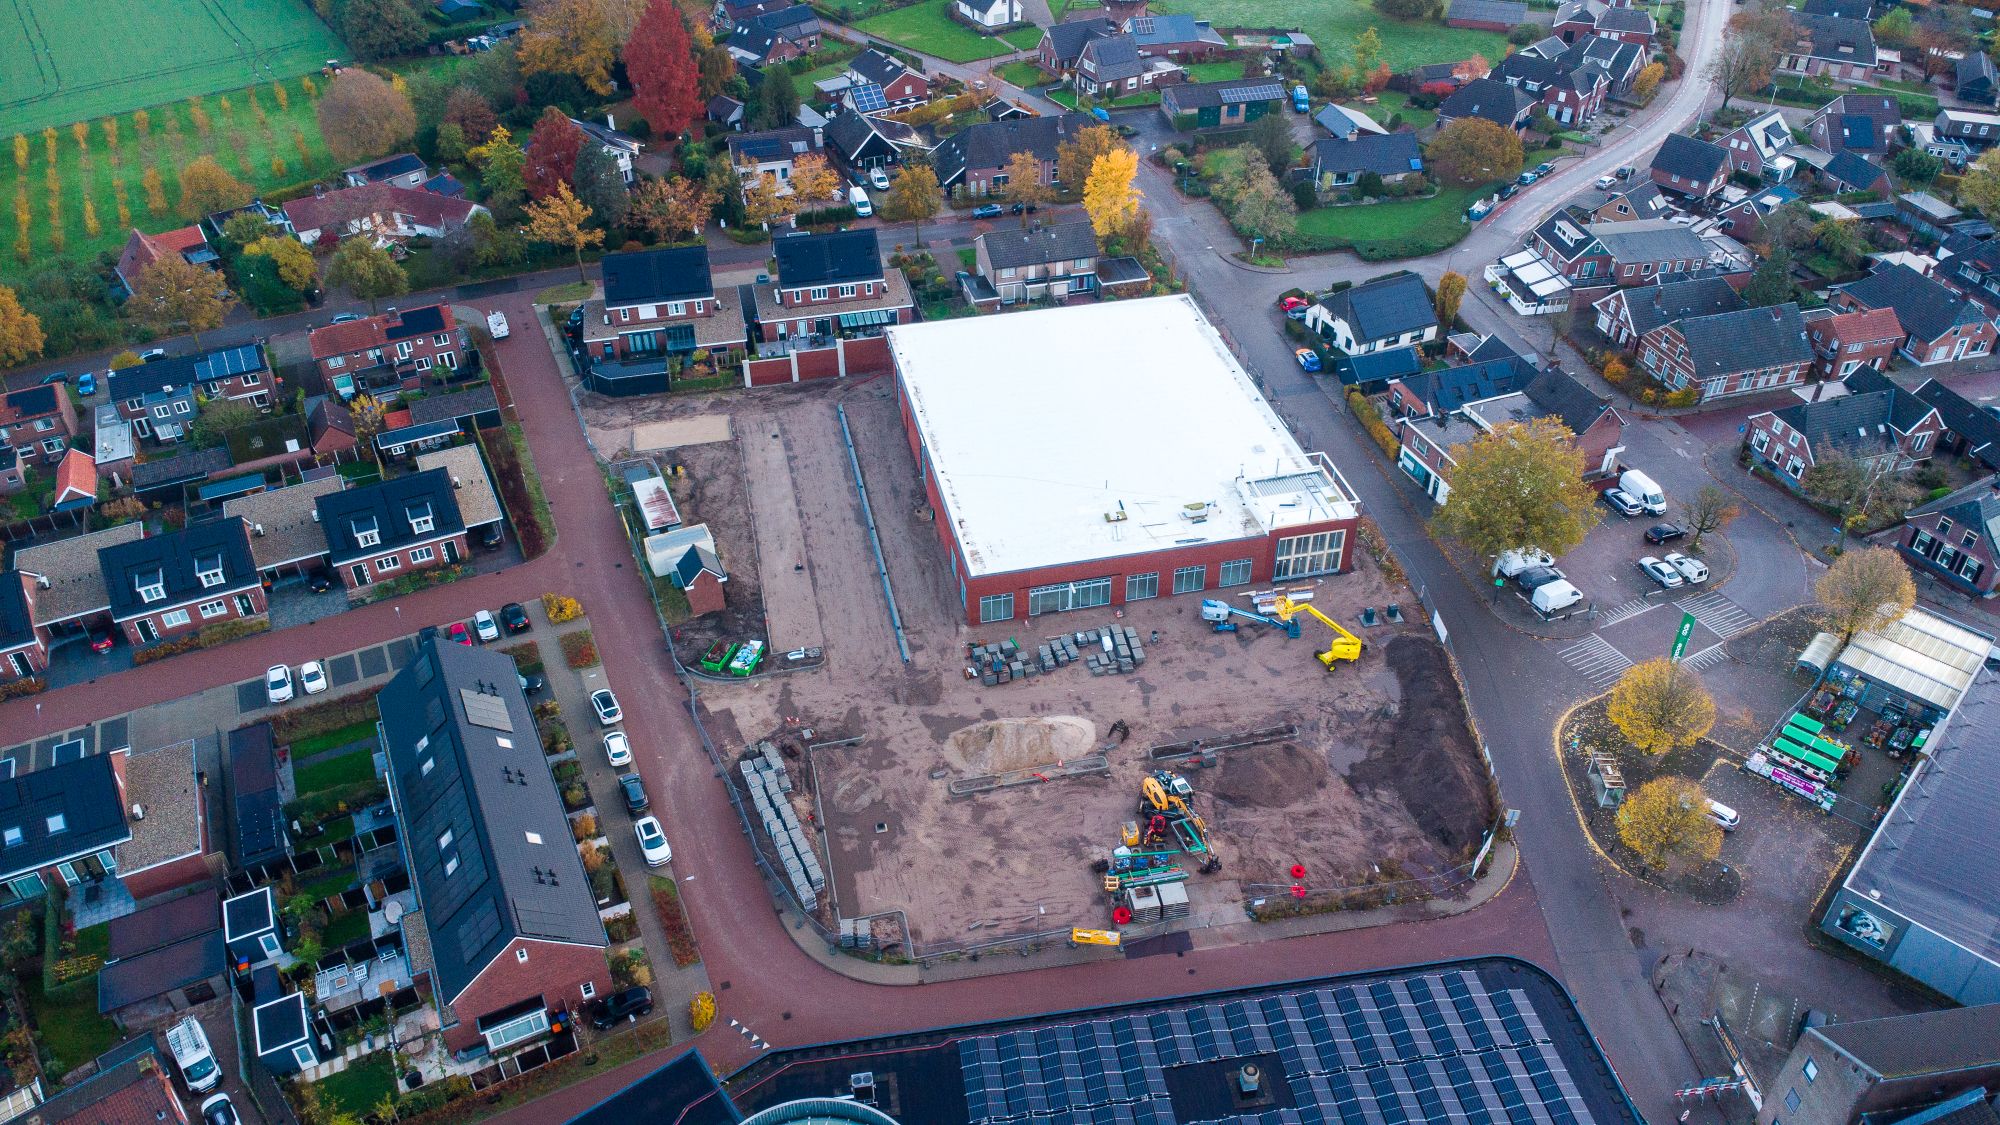
Frequent observations turn a collection of images into a time series. Instead of asking only whether a pixel looks different in 2025 than it did in 2018, researchers can examine when its pattern changed and whether that change persisted. A construction site may begin with cleared vegetation, pass through exposed soil and unfinished structures, and eventually settle into the more stable signature of completed roofs, pavement, or landscaping.
To find those signals, the team built on a method called CAPES, developed in earlier work by Jae Woong Suh, Zhu, and colleagues. The name stands for “Classify Areas with Potential and then Exclude the Stable pixels.” In broad terms, the method first identifies places that could contain construction-related change, then removes areas whose satellite record remains stable. Deep-learning classification and time-series analysis help separate meaningful surface changes from the enormous amount of land that is not actively being rebuilt.
The resulting Urban Pulse describes two related qualities. Activity reflects how much of a neighborhood is changing at a given time, while intensity describes the strength of that change. A wide area of modest work and a compact, dramatic redevelopment may therefore produce different signatures. The pulse is not a photograph of economic health; it is a measurement of physical change that must be interpreted with other evidence.
Six cities showed the same stop-and-start rhythm
The researchers tested the framework in Dubai, Lagos, Mexico City, Mumbai, Seattle, and Shenzhen. These cities differ in climate, income, building form, government, and recent development history. Within each one, the team compared five nearby neighborhoods rather than treating the entire urban area as a single unit. That design made it possible to ask whether neighboring districts rose and fell together.
Across all six cities, the pulses were spiky, cyclical, and asynchronous. Spiky means that physical change was concentrated in bursts rather than distributed evenly across time. Cyclical means active periods were followed by stabilization, renewed development, or decline. Asynchronous means nearby neighborhoods often followed different schedules, even though they belonged to the same city and were exposed to some of the same regional forces.
The COVID-19 period provided a revealing stress test. Construction activity fell at roughly the same time in many of the observed locations, producing a rare shared disturbance. The recoveries were less uniform. Different cities and neighborhoods resumed change on different schedules, showing why a single statement about “urban recovery” can conceal important local variation.
That pattern changes how urbanization should be pictured. The usual image of a colored area spreading steadily across a map is not wrong, but it is incomplete. Cities also change internally through redevelopment, repairs, demolition, infrastructure work, and the filling of overlooked parcels. Growth can jump from one corridor to another, pause during a financial or political shock, and restart somewhere else.
What planners can learn—and what satellites cannot
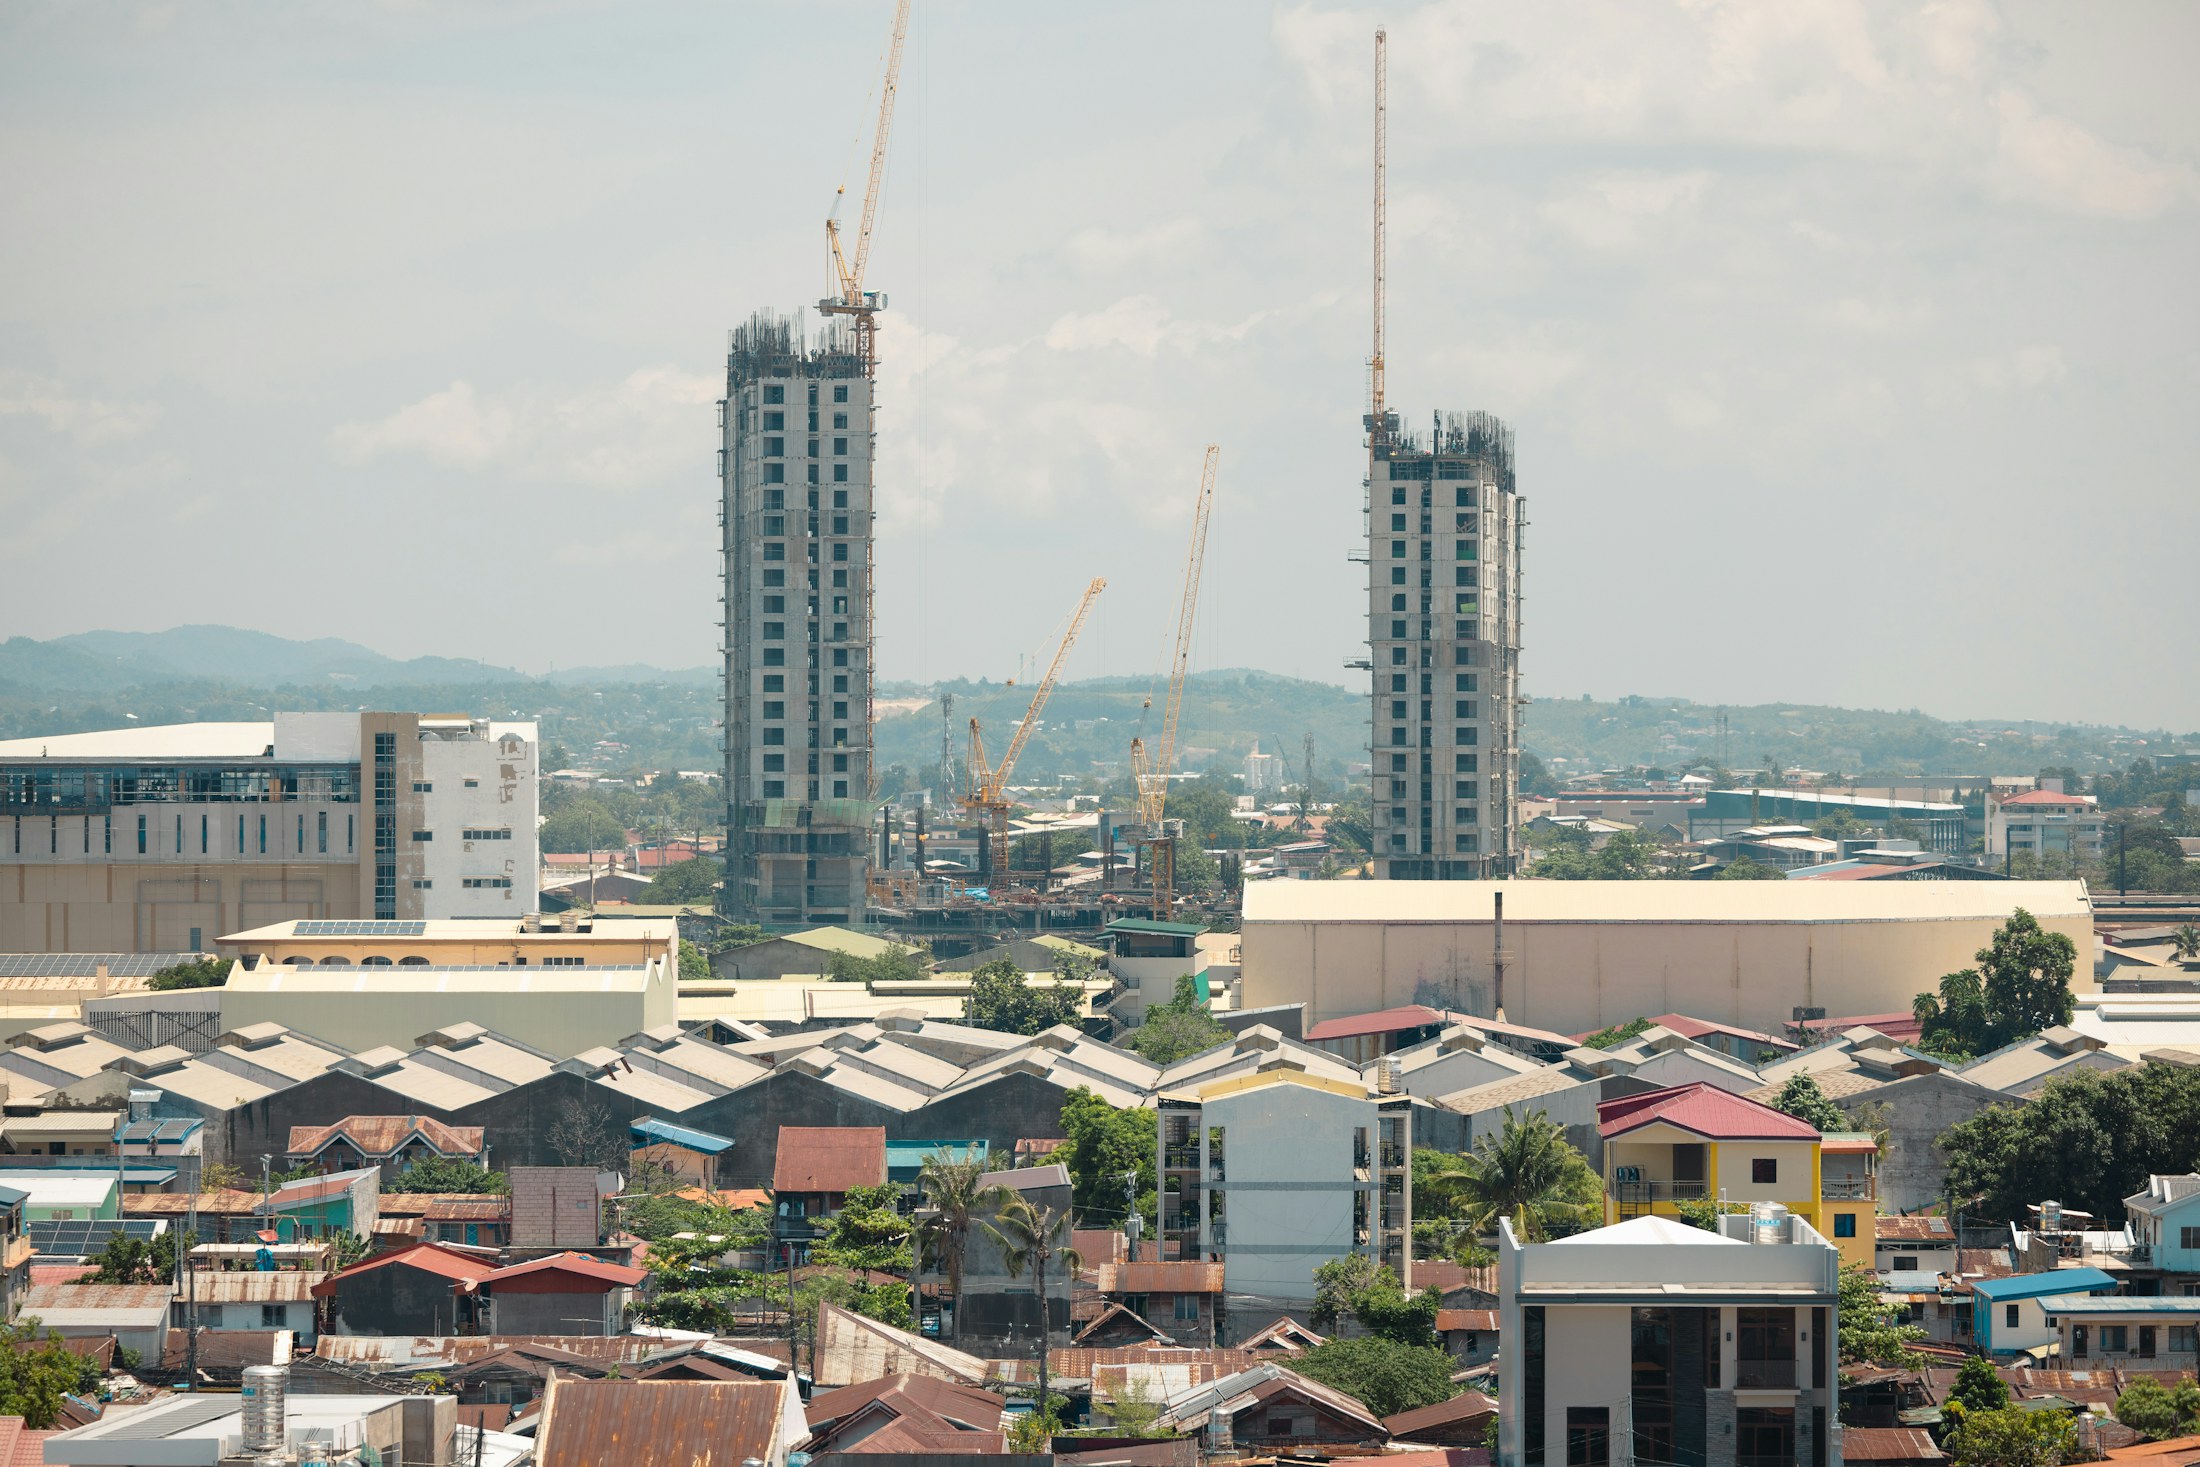
A timely neighborhood pulse could help officials decide where to look more closely. A sharp rise in construction may signal future pressure on roads, transit, drainage, schools, clinics, electricity, or emergency services. A prolonged slowdown could prompt questions about stalled projects, disinvestment, or the effects of a disaster. Repeated observations may also show whether development is pushing into wetlands, farmland, forests, or other land that provides environmental protection.
The method could be especially valuable where permit records are incomplete, inconsistent, or difficult to compare across jurisdictions. Satellite observations follow the same physical surface regardless of administrative boundaries. That consistency makes cross-city research more practical and can reveal activity that conventional datasets miss. It does not make local records unnecessary; it gives researchers another independent line of evidence.
The limitations are just as important. A satellite can detect altered land cover, but it cannot automatically explain why the change occurred. Similar signals might come from a housing project, road reconstruction, demolition, storm damage, or a cleared site that is later abandoned. Clouds can reduce the number of usable observations, and a 30-meter pixel can mix several features in a dense urban block. The method also measures the built environment, not whether new housing is affordable, whether residents were displaced, or whether a completed building is occupied.
For those reasons, the pulse works best as a diagnostic clue rather than a verdict. Planners would still need permits, field surveys, utility records, local reporting, and conversations with residents to understand what a spike means. A medical pulse can show that something has changed without naming the cause; the urban version has a similar role. Its strength is directing attention to the right place and time.
Why the rhythm of growth matters
Urban growth affects more than skylines. A burst of construction can alter traffic, water demand, flood risk, school enrollment, housing costs, and access to green space long before a new census count captures the shift. Seeing that burst early gives communities a better chance to investigate its consequences and respond while decisions are still being made.
The Urban Pulse also offers a more honest way to describe cities. They are not single organisms moving neatly from one stage to the next. They are collections of neighborhoods shaped by different investments, constraints, histories, and shocks. Frequent satellite records make those uneven paths visible, but local knowledge gives them meaning.
The deepest finding is therefore not that satellites can watch construction. It is that the timing of change carries information that a before-and-after map throws away. When urban growth is viewed as a sequence rather than a snapshot, a city’s apparent stillness gives way to many overlapping rhythms—and the neighborhoods hidden inside the average finally come into focus.