Akshay Dinesh
When a hurricane moves away, the view from the ground is fragmented. One road may be blocked by trees, another may be under water, and damaged bridges can keep survey crews from reaching entire neighborhoods. From an aircraft, those separate problems become part of one visible pattern. A sequence of high-resolution photographs can show where flooding spread, dunes disappeared, boats shifted onto land, roofs failed, and debris obstructed a port.
That is why mapping flights often begin as soon as wind, clouds, and airport conditions allow. After Hurricane Isaias in October 2026, the National Oceanic and Atmospheric Administration sent aircraft over parts of the northern Gulf Coast and published imagery from Port St. Joe to the Chandeleur Islands. The photographs were not simply a record of destruction. Once tied to coordinates and compared with earlier data, they became working maps for response, recovery, and later research.
The first task is deciding where to fly
A damage survey cannot photograph every place at once. NOAA’s National Geodetic Survey works with the Federal Emergency Management Agency and state and local partners to identify priority areas. Ports, waterways, barrier islands, dense communities, industrial sites, and places with reports of severe damage may move toward the front of the queue. Flight planners then arrange long, parallel paths that let a camera cover the target area in overlapping strips.
Timing is a tradeoff. Responders need images quickly, but an aircraft cannot safely collect useful photographs through dangerous winds, low clouds, or heavy rain. Sun angle matters as well. Long shadows can hide damage, glare can obscure water, and haze can reduce contrast. A team may also need to avoid restricted airspace or coordinate with search-and-rescue aircraft already operating nearby.
The camera points mostly downward and takes photographs at short intervals as the plane follows each flight line. Neighboring frames overlap, and adjacent strips overlap too. That repetition is intentional. It prevents gaps and gives mapping software multiple views of the same roofs, roads, beaches, and landmarks. A survey is therefore planned less like a sightseeing flight and more like mowing a large lawn in careful, measured passes.
How photographs become a geographic dataset
A raw photograph can show a damaged building, but responders also need to know exactly where that building is. Survey aircraft record position and orientation along with each exposure. Satellite-navigation receivers establish the aircraft’s location, while an inertial measurement unit records how it tilted and turned. Those measurements allow each frame to be georeferenced, meaning that points in the image are connected to real coordinates on Earth.
Mapping teams also correct for the way terrain, camera angle, and lens geometry distort an ordinary aerial photograph. This process, called orthorectification, makes distances and positions more consistent across the image. Overlapping frames can then be joined into an orthomosaic: a broad, map-like surface assembled from many photographs. Instead of opening hundreds of separate files, a user can pan across a coastline and zoom into a street or marina.
Resolution determines what can be distinguished. NOAA’s emergency-response archive commonly provides imagery with pixels representing roughly 0.3 to 0.5 meter on the ground, although a particular mission can differ. That scale is detailed enough to reveal large debris piles, displaced vessels, washed-out road sections, and major roof damage. It does not mean every small object is identifiable, and a sharp image is not the same as a complete engineering inspection.
Speed matters almost as much as precision. The National Geodetic Survey says emergency imagery can be processed and distributed within hours of an aircraft landing. Publishing it through a geographic information system lets agencies view the photographs alongside roads, property boundaries, water levels, hazard reports, and other operational layers.
Before-and-after views reveal the change
Damage becomes easier to interpret when a post-storm image has a good baseline. A dark patch may be floodwater, a permanent pond, or a shadow; an earlier view helps separate those possibilities. The same comparison can reveal lost vegetation, new inlets through barrier islands, eroded dunes, shifted shorelines, damaged roofs, and debris that was not present before the storm.
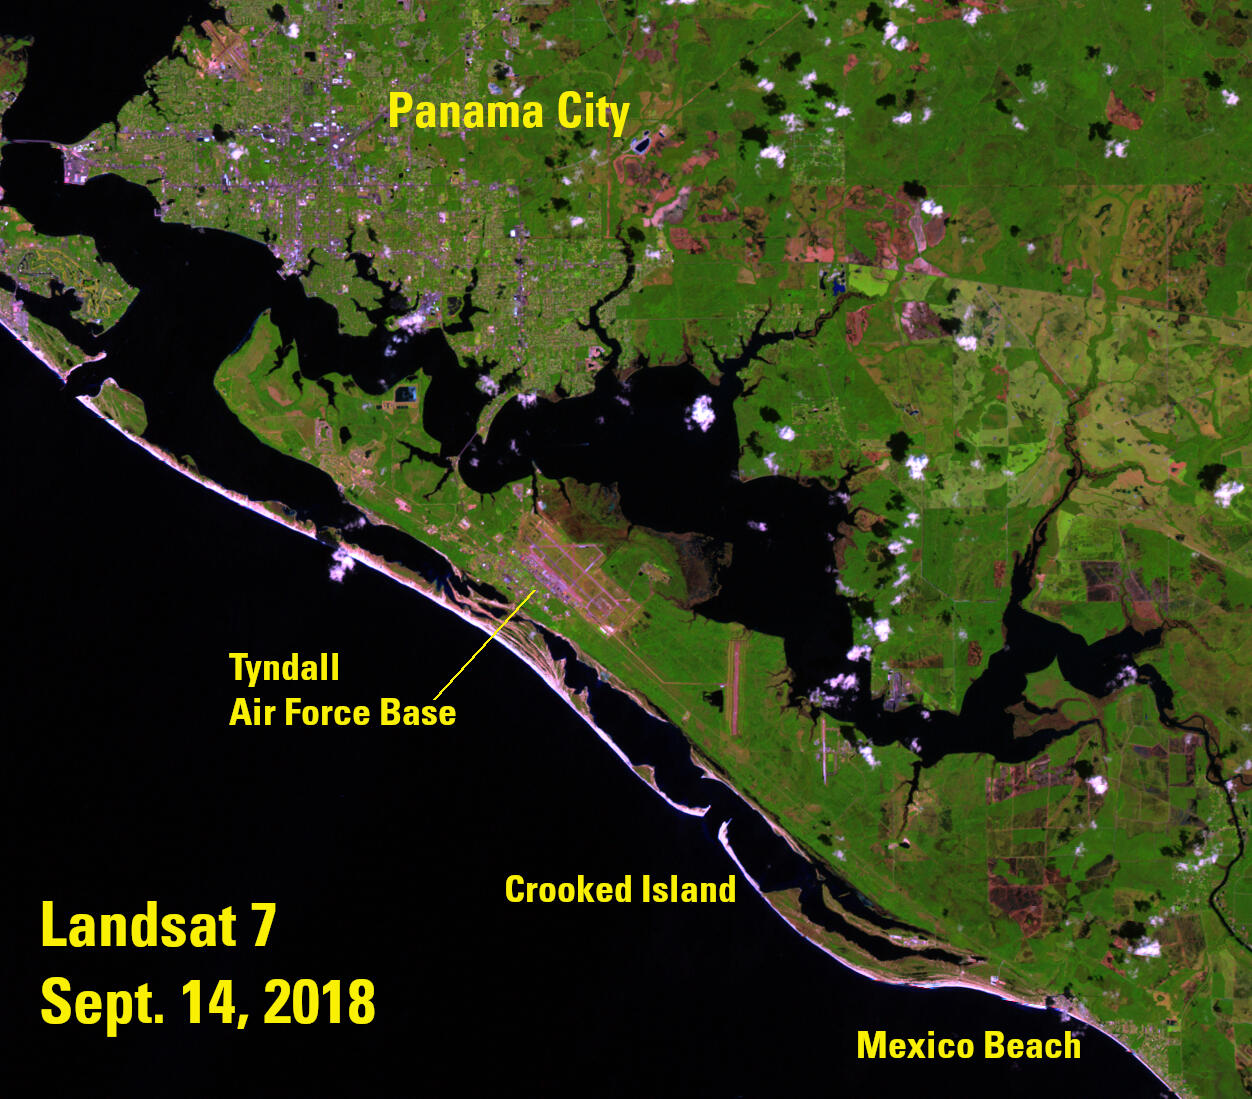
This Landsat view provides a regional baseline for Panama City, Florida, before Hurricane Michael made landfall in 2018. Coastlines, waterways, vegetation, and the urban area form a reference pattern. Because satellites repeatedly observe the same region, their archives are especially valuable when a disaster strikes somewhere that did not receive a dedicated pre-storm aircraft survey.
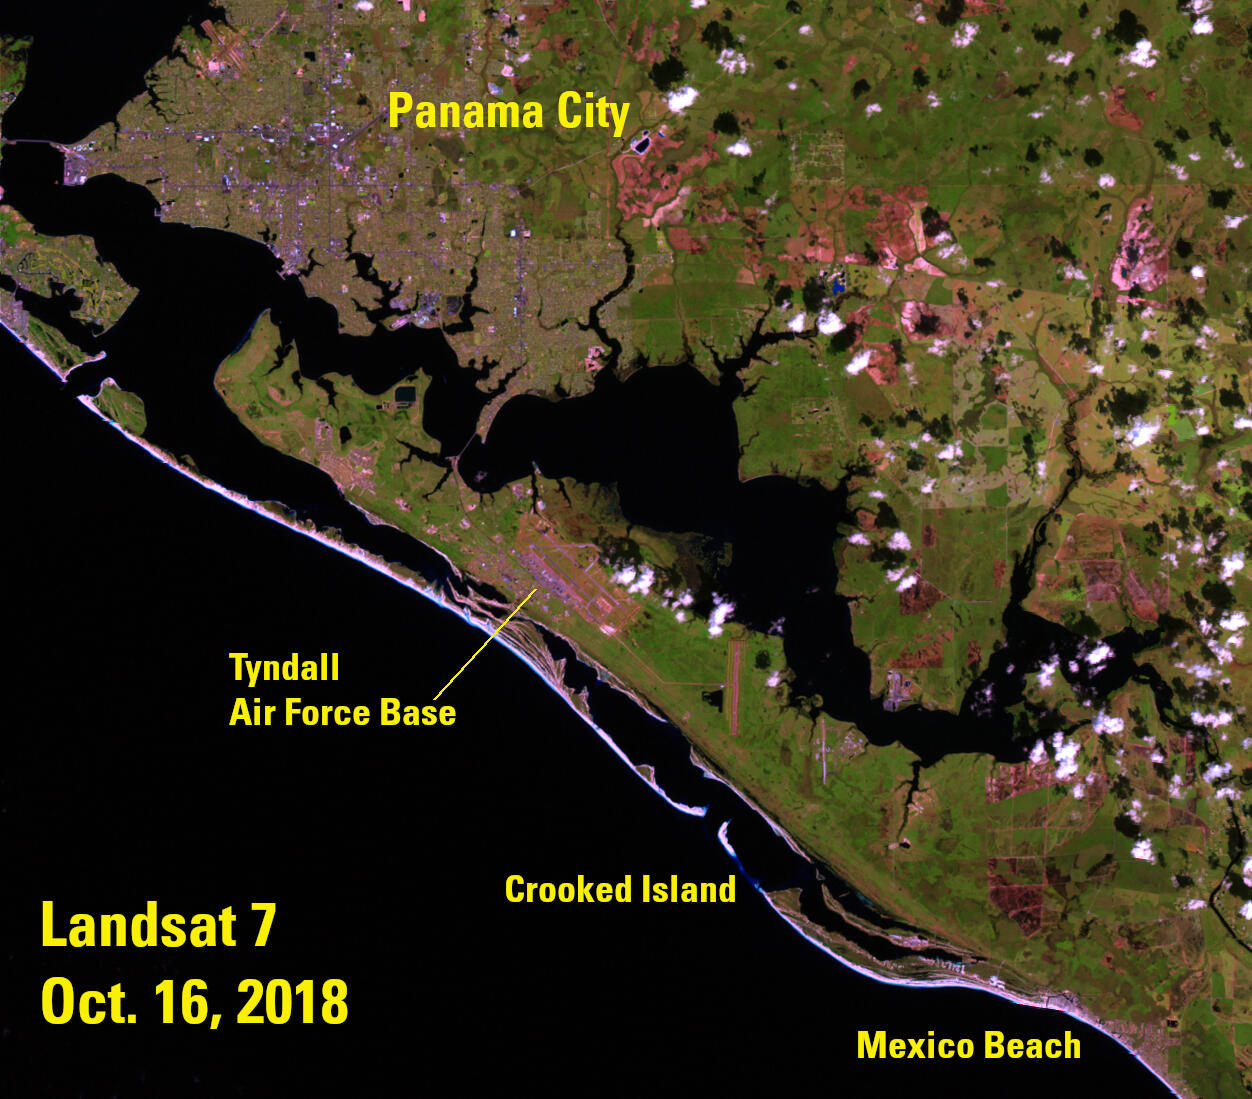
In the later image, broad changes become visible even before individual buildings are examined. The U.S. Geological Survey uses comparisons like this to map inundation, vegetation loss, beach and dune erosion, and damage to infrastructure. Other layers add depth. Lidar measures elevation with laser pulses, field teams record high-water marks, and tide gauges document water levels. Together, these observations can show not only what looks different, but how the storm reshaped the land and how high the water reached.
Comparison still requires care. The two images should be aligned closely, and differences in season, tide, sunlight, vegetation, or camera system can imitate change. Analysts look for consistent shapes and corroborating evidence rather than treating every color difference as damage.
Aircraft and satellites answer different questions
Satellite imagery covers enormous areas and can reveal a storm’s regional footprint. Landsat, for example, is useful for examining flooding, vegetation change, and coastal conditions across many kilometers. Other satellite sensors can observe clouds, temperature, rainfall, or radar reflections. Their repeated passes also create long archives that make before-and-after analysis possible.
Aircraft trade breadth for detail and flexibility. A crew can be directed toward a particular harbor, island, or neighborhood and can collect sharper imagery beneath many high clouds. NOAA uses directly georeferenced aerial photographs to help identify navigation hazards, hazardous-material spills, stranded vessels, blocked routes, and damage to critical infrastructure. Members of the public can also use the emergency viewer to inspect affected communities when roads remain inaccessible.
Neither platform replaces fieldwork. A roof can appear intact from above while water or wind has damaged the interior. Tree cover may conceal a road, standing water may hide a washed-out surface, and a vertical photograph cannot show every wall. Emergency managers combine imagery with calls for assistance, ground reports, drone surveys, engineering inspections, water-level records, and local knowledge.
The scale of the decision determines the best source. Satellite data may show which counties experienced widespread flooding. Aerial imagery may identify the marina entrance blocked by debris. A field inspection can determine whether the dock is structurally sound. The useful map is often a stack of different observations rather than a single perfect picture.
What a damage map can and cannot decide
Rapid imagery helps teams prioritize limited time and equipment. It can point search crews toward cut-off areas, help transportation officials assess access routes, show port authorities where navigation hazards may remain, and give recovery planners an early picture of the storm’s footprint. Repeated surveys can later measure shoreline recovery, rebuilding, or the cumulative effect of closely spaced storms.
But a rapid-response image is evidence, not a final verdict. NOAA’s Digital Coast cautions that its emergency product is intended for visual damage analysis rather than mapping, charting, or navigation. The imagery may have gaps, positional uncertainty, cloud or shadow interference, and features that require confirmation. It should not be used by itself to declare a building safe, settle an insurance claim, or guide a vessel through a changed channel.
There is also a human dimension to an overhead view. Each damaged roof or flooded street belongs to people who may have lost homes, work, transportation, or access to medical care. Good damage mapping turns the image into action: reopening a route, directing a crew, documenting a hazard, or choosing where detailed inspection should begin.
The power of aerial imagery lies in that conversion. A camera records light reflected from the ground; navigation instruments attach location; processing removes much of the geometric distortion; and comparison gives the scene meaning. Within hours, thousands of separate photographs can become a shared geographic picture. After a hurricane has made the ground difficult to reach, that picture helps responders see where the next decision matters most.