 Akshay Dinesh
When wildfire smoke drifts into a neighborhood, the air can look different from one block to the next. A hill, a line of trees, a freeway, a sea breeze, or a gap between buildings can change where particles collect. That is why people often check local air readings before opening windows, walking outside, practicing sports, or deciding whether an air purifier is helping indoors.
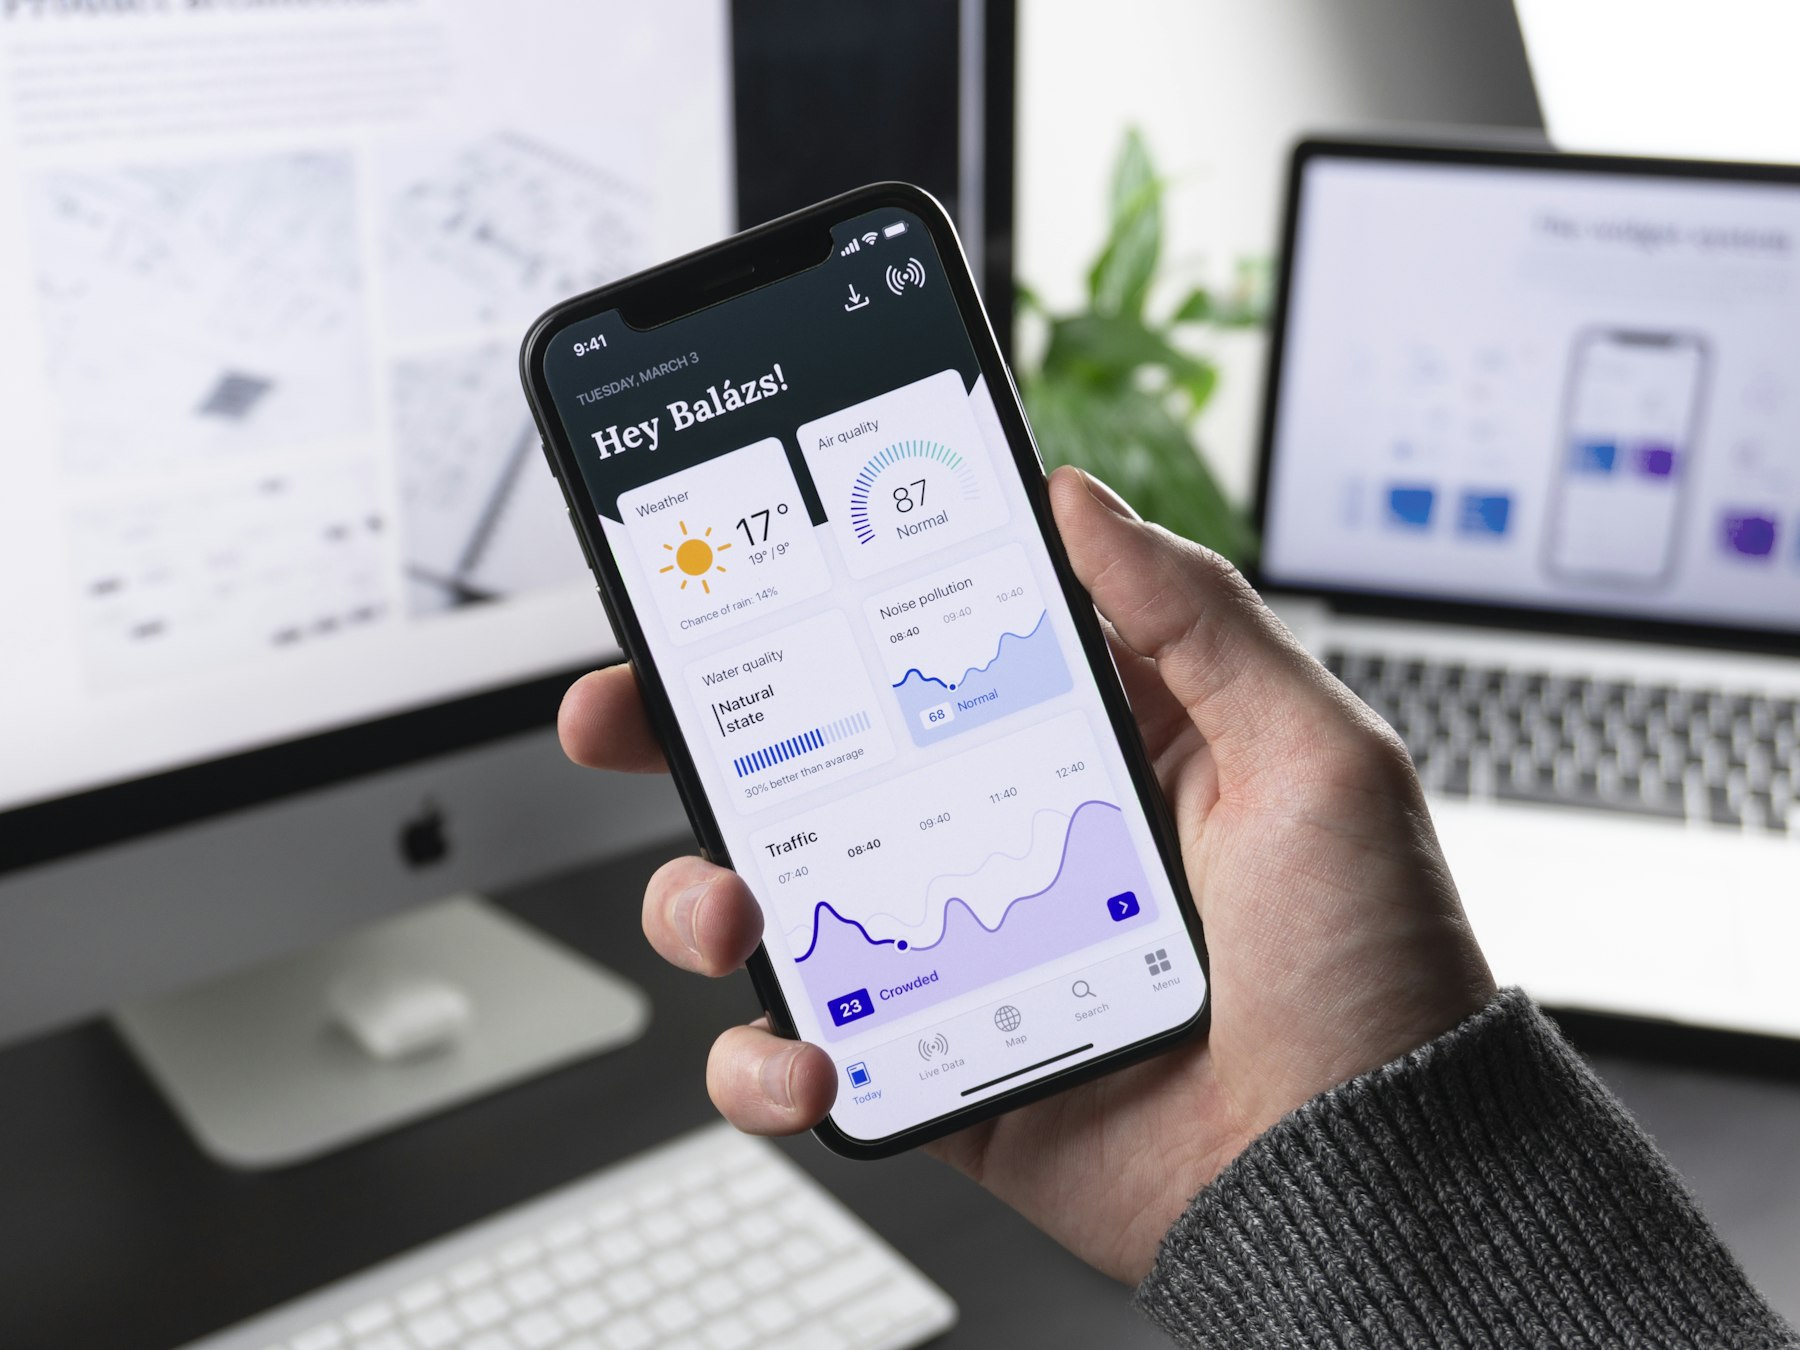
Small air quality sensors have made those local readings easier to see. Instead of waiting for the nearest official monitor, which may be miles away, a sensor can estimate fine particle pollution near a home, school, library, or street corner. The extra detail is useful, especially during wildfire-smoke events. It also comes with a warning: a sensor reading is not the same thing as a perfect measurement. To use it well, it helps to know what the device is actually sensing, why the number may shift, and when official Air Quality Index information still matters most.
What air quality sensors are trying to measure
Many consumer and community air quality sensors focus on PM2.5, a category of fine particulate matter. The name refers to particles with diameters of 2.5 micrometers or smaller. They are far thinner than a human hair, and they can come from wildfire smoke, vehicle exhaust, wood burning, some industrial activity, and other combustion sources.
PM2.5 matters because small particles can travel deep into the lungs. The U.S. Environmental Protection Agency uses PM2.5 as one of the pollutants behind the Air Quality Index, the color-coded scale many people see during smoke events. During wildfires, AirNow’s Fire and Smoke Map pays special attention to fine particle pollution because smoke is rich in these tiny particles.
A sensor does not usually identify every chemical in the air. It is not telling you the full story of ozone, carbon monoxide, nitrogen dioxide, pollen, mold, or gases released by a nearby source. Most small smoke-focused sensors are answering a narrower question: how much fine particle pollution seems to be passing through the device right now?
How a small sensor turns particles into a number
Most low-cost PM2.5 sensors use an optical method. A tiny fan or opening moves air through a chamber. Inside, a beam of light passes through that air. When particles move through the beam, they scatter light, and a detector measures the scattering. Software then estimates particle counts and converts them into a concentration, usually reported in micrograms per cubic meter.
That conversion is the tricky part. A sensor can count how much light is scattered, but different particles scatter light differently. Fresh wildfire smoke, older smoke, dust, humidity-swollen particles, and urban pollution may not behave the same way. If two air samples have the same mass of particles but different shapes or moisture levels, the sensor may not interpret them identically.
Official monitoring instruments are built, sited, calibrated, and quality-checked under stricter rules. They are used for regulatory decisions and long-term air-quality records. Low-cost sensors are usually smaller, cheaper, quicker to deploy, and more numerous. That makes them valuable for local awareness, but it also means their readings often need correction and comparison with reference-grade monitors.
Why nearby readings can disagree
Two sensors in the same town can show different numbers without either one being useless. Air moves unevenly. Smoke can settle in valleys, thin out on windy streets, or surge when a plume passes overhead. An indoor sensor near a leaky door may respond differently from one beside a filtered air cleaner. Even outdoors, a sensor near a grill, idling vehicle, dusty road, or chimney may spike for reasons that do not represent the wider neighborhood.
Placement also changes readings. A sensor mounted too close to a wall, vent, roofline, or direct source of smoke may sample air that is not well mixed. Rain, fog, high humidity, insects, dust buildup, and sunlight exposure can affect performance. Some devices respond quickly but noisily, while official AQI reports often use averaging periods that smooth short bursts into a more stable public-health signal.
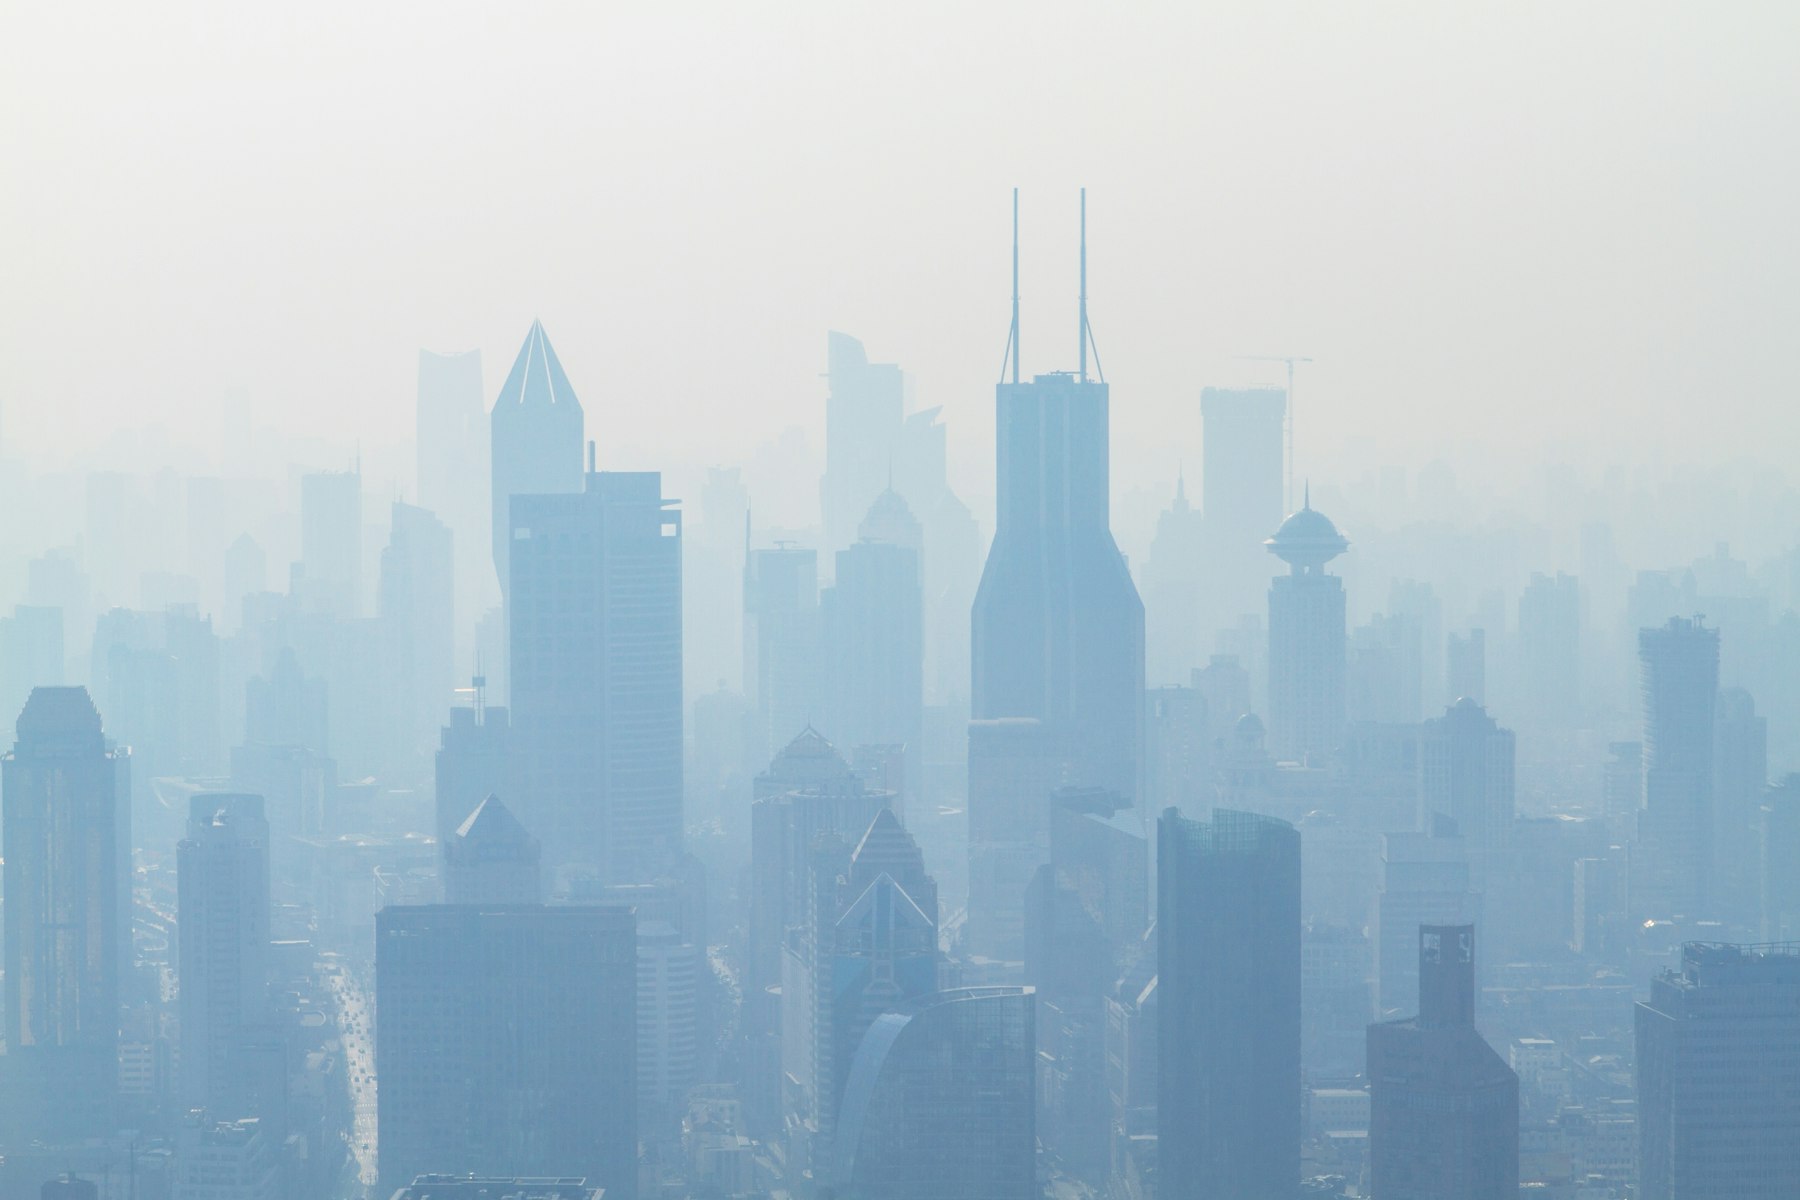
This is why one number should not be treated like a verdict. A sensor reading is most useful when it is compared with nearby sensors, recent trends, official monitors, and what is happening outside. If several nearby sensors rise at the same time while smoke is visible and official reports also show worsening PM2.5, the pattern is more trustworthy than a single lonely spike.
How AirNow uses sensor data carefully
The EPA and the U.S. Forest Service have worked sensor data into the AirNow Fire and Smoke Map because official monitors cannot cover every community. During smoke events, extra sensors can reveal local changes in places that would otherwise have little nearby information. That wider coverage can help people decide when to reduce outdoor activity, close windows, run filtration, or check on someone more vulnerable to smoke.
AirNow does not simply treat every small sensor as equal to an official monitor. Its smoke map applies screening and correction steps so sensor data is more comparable with regulatory monitors. EPA technical materials describe correction approaches for PurpleAir PM2.5 sensors, including work on a U.S.-wide correction equation and additional methods for extreme wildfire smoke. The point is not to make low-cost sensors perfect. It is to make their readings more useful and less misleading when many people are depending on them.
The Fire and Smoke Map also has limits. It emphasizes fine particle pollution, not every possible pollutant. A low PM2.5 reading does not prove the air is free of all health concerns, and a sensor map is not a replacement for local emergency instructions. During major fires, chemical releases, dust storms, or unusual industrial events, official public-safety information should carry more weight than a consumer device.
What a sensor can help you decide
A sensor is especially helpful for watching change over time. If indoor PM2.5 drops after a portable HEPA air cleaner turns on, that trend can show that filtration is making a difference. If a room’s reading climbs whenever a door opens during a smoky afternoon, the sensor can reveal how quickly outdoor air is getting inside. If outdoor readings improve after a wind shift, it may point to a better window for a short errand or a lower-risk time for necessary outdoor work.
The best use is practical, not obsessive. A sensor can help answer everyday questions such as whether the cleanest room is actually cleaner, whether smoke is leaking into a building, or whether outdoor air has improved enough to ventilate briefly. For schools, libraries, community centers, and families, those local patterns can be more actionable than a distant monitor alone.
It is still wise to think in ranges rather than exact points. A reading of 83 and a reading of 91 may not deserve two completely different decisions. A move from 20 to 160 is more meaningful. The trend, the AQI category, the smoke conditions, and the needs of the people exposed all matter together.

How to read sensor numbers without overreading them
Start by checking whether the reading is indoors or outdoors. Indoor numbers are shaped by filtration, cooking, candles, vacuuming, open windows, and ventilation. Outdoor numbers are shaped by weather, terrain, traffic, smoke plumes, and where the sensor is mounted. Mixing the two without noticing can lead to confusing conclusions.
Next, compare the sensor with a trusted public source. If AirNow, a state environmental agency, or a local health department reports poor air quality, take that seriously even if one nearby sensor looks calmer. If a sensor shows a sudden jump that no nearby monitors share, look for a local cause before assuming the whole area has changed. A grill, construction dust, or a passing vehicle can briefly distort the picture.
Finally, remember that health guidance often depends on the person. Children, older adults, pregnant people, outdoor workers, and people with asthma, heart disease, or other health conditions may need to act sooner when PM2.5 rises. A sensor can show conditions, but it cannot know who is breathing the air or what medical advice they have been given.
Air quality sensors are best understood as local clues. They make invisible particles easier to notice, show patterns that distant monitors may miss, and help people test whether smoke-reduction steps are working. Their strength is immediacy; their weakness is precision. Used alongside official AQI information and common sense about local conditions, they turn a vague smoky sky into a clearer picture of what is happening in the air nearby.