Akshay Dinesh
Two weather apps can look at the same town on the same afternoon and still give different answers. One says rain starts at 2 p.m. Another says it stays dry until dinner. A third shows a lightning icon all day, even though the sky outside looks calm. That does not always mean one forecast is careless and the other is correct. It usually means the atmosphere is changing, the data are incomplete, and each app is turning a complicated forecast process into a small symbol on a screen.
A forecast is not a snapshot of the future. It is an informed estimate built from observations, computer models, local knowledge, probabilities, and timing. The National Weather Service, private forecast providers, and global modeling centers all work with the same basic challenge: the atmosphere is a moving fluid, and small differences in temperature, moisture, wind, and pressure can grow into larger differences over time. When an app shows one clean number, it is hiding many judgment calls behind that number.
Forecasts Start With Measurements, Not Certainty
Every forecast begins with what is happening now. Weather balloons, satellites, radar, surface stations, aircraft reports, ocean buoys, and other observing systems feed data into forecast systems. Those observations are powerful, but they are not perfect. The atmosphere is measured at many points, not every point, and some places are easier to observe than others. A city with dense weather stations, radar coverage, and airport observations gives forecasters more clues than a remote valley or stretch of open water.
Even nearby neighborhoods can behave differently. A hill, lake, sea breeze, downtown heat, forested area, or wide-open field can shift local temperature and rainfall. If one app estimates conditions for a grid point near the airport while another adjusts more heavily for your street or elevation, the forecast can split. The difference may be small, such as 72 degrees versus 75 degrees, but small differences matter when the question is whether rain freezes, whether fog forms, or whether a thunderstorm has enough fuel to grow.
Good forecasts also depend on how fresh the data are. Some apps update frequently, while others may keep an older forecast visible for longer. If a storm line speeds up, weakens, or shifts east, an app that has pulled in newer radar and model guidance may change before another app does. That is why disagreements often feel sharp during active weather and milder during quiet, stable conditions.
Different Models Can Tell Different Stories
Weather models are mathematical simulations of the atmosphere. They divide the air into a grid, use physics equations to estimate how conditions will change, and then step forward through time. Models do not all divide the atmosphere the same way. Some cover the whole world at a broader scale. Others focus on smaller regions with finer detail. Some update more often. Some handle clouds, mountains, ocean temperatures, or thunderstorms differently.
This is one reason a forecast can diverge before a storm arrives. A model that places a cold front slightly farther west may bring rain earlier. Another may keep the front weaker and delay storms until evening. A high-resolution model might show scattered storms popping up in one county, while a broader model smooths that risk across a larger area. Apps then decide which model, blend of models, or forecast provider to trust most for each time and place.
Forecasters often compare many model runs instead of trusting only one. Ensemble forecasting takes that idea further by running related forecasts with slightly different starting conditions or model settings. If most members of an ensemble show rain, confidence rises. If the members scatter in different directions, the forecast should be treated as less certain. An app may show that uncertainty as a percentage, a range, a storm icon, or a cautious phrase. Another may compress the same uncertainty into a single hourly answer.
The Rain Percentage Is Easy to Misread
Probability of precipitation is one of the most misunderstood parts of a forecast. A 40 percent chance of rain does not mean it will rain for 40 percent of the day. It also does not mean 40 percent of the area will definitely get wet in every case. In public forecasts, it is a probability statement about measurable precipitation at a point or across a forecast area during a specified time period. The exact presentation can vary by provider and by app design.
That creates plenty of room for disagreement on a phone screen. One app may show a 40 percent chance for the whole afternoon. Another may break the same risk into hourly blocks and show 20 percent at noon, 50 percent at 3 p.m., and 30 percent at 6 p.m. A third may decide that any meaningful thunderstorm risk deserves a storm icon, even if much of the day stays dry. The apps may be describing similar uncertainty, but the display makes them look more different than they are.
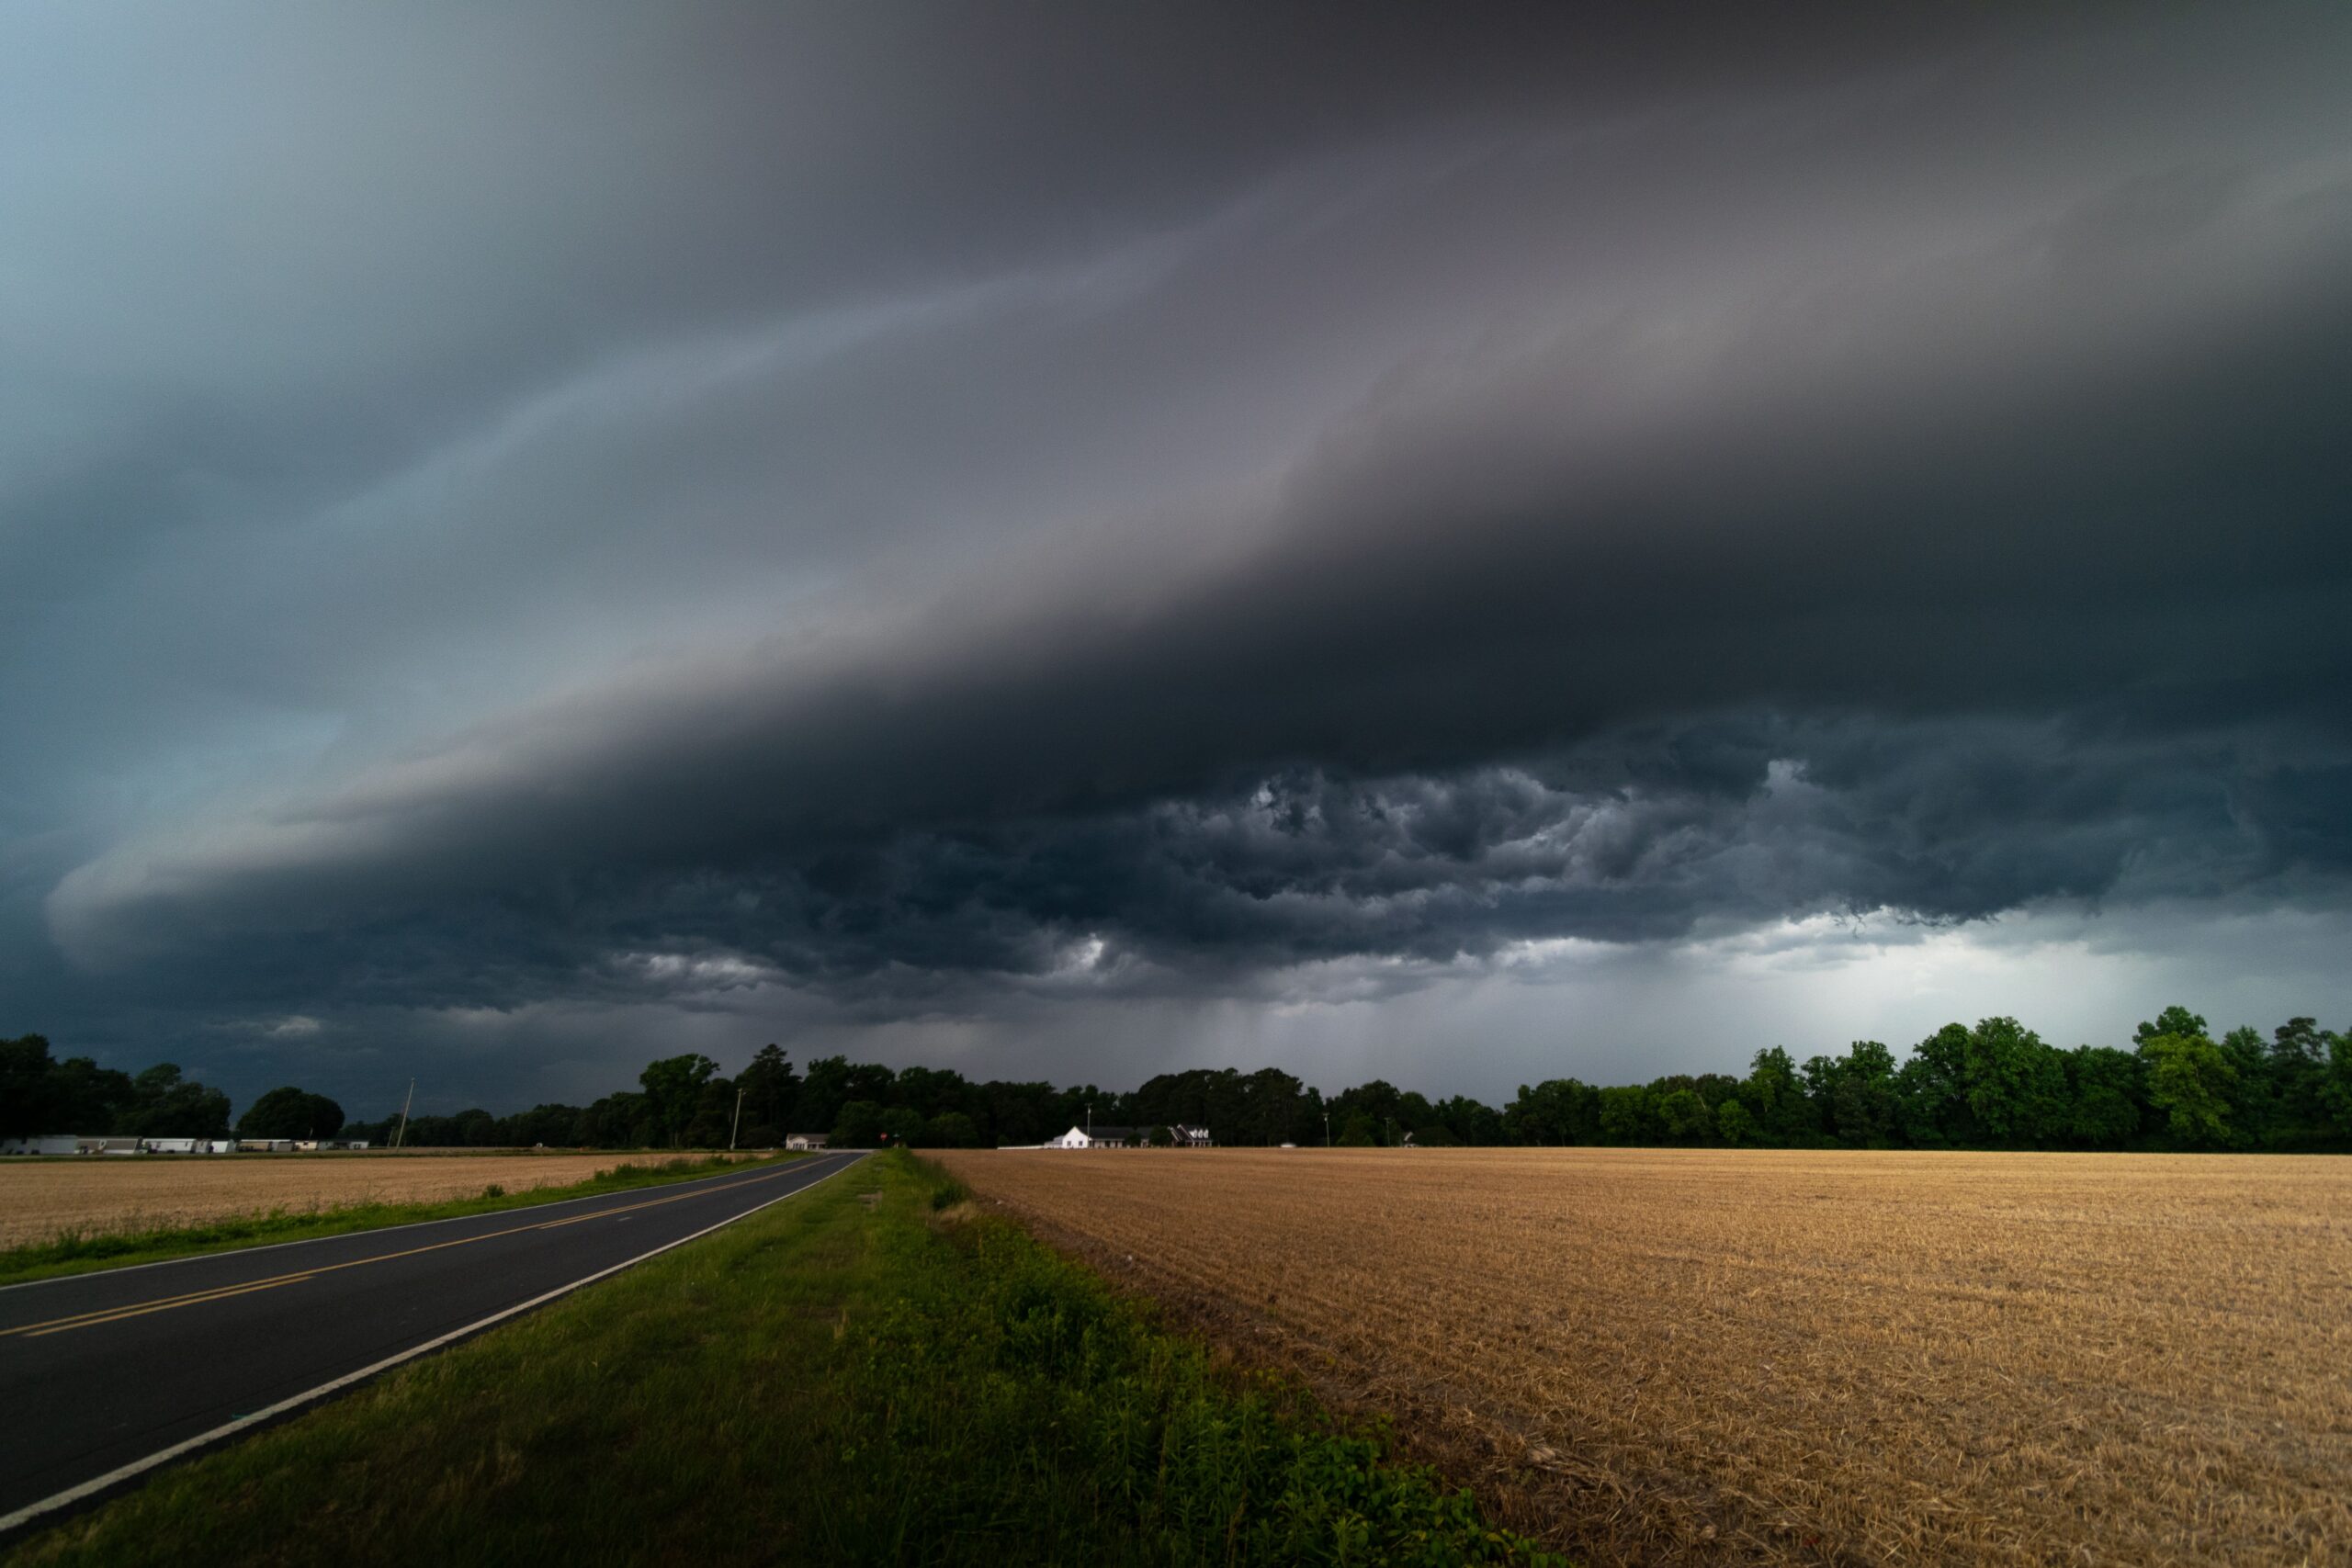
The type of weather matters too. Large, steady rain systems are usually easier to time and map than scattered summer thunderstorms. A wide shield of rain moving with a front can cover many counties for hours. Pop-up storms may form quickly, rain hard on one neighborhood, and miss another area a few miles away. In that second case, two apps can disagree because the real atmosphere has not yet made its final choice at the scale people care about.
Location and Timing Change the Forecast You See
A forecast depends on exactly where and when it is being asked. Many apps let users search by city name, ZIP code, current GPS position, school, airport, or saved place. Those may not point to the same forecast location. A city forecast can represent a central point or official station, while a phone location may land in a suburb, valley, campus, or coastal neighborhood. The app may also shift between nearby forecast zones without making that change obvious.
Timing adds another layer. Weather does not move in neat hourly boxes. A storm that reaches a town at 2:50 p.m. may appear in one app as a 2 p.m. risk and in another as a 3 p.m. risk. Temperature forecasts can differ for similar reasons. One app may expect clouds to arrive before the afternoon high is reached, while another expects more sun and a warmer peak. If clouds arrive only an hour earlier than expected, the final temperature can miss by several degrees.
Short-range forecasts also lean heavily on recent radar and satellite trends, while longer-range forecasts depend more on model guidance and larger weather patterns. That is why apps may converge when rain is already visible on radar and diverge again when the question moves several days ahead. The farther out the forecast reaches, the more small starting differences can grow.
Icons Can Make Forecasts Look More Certain Than They Are
Weather icons are useful because they are quick. They are also blunt. A tiny cloud, sun, raindrop, or lightning bolt has to represent hours of changing sky conditions. If the morning is sunny, the afternoon is mostly cloudy, and an evening thunderstorm is possible, one app might choose a partly cloudy icon while another shows storms. Both may be defensible, but the icon alone cannot explain the timing.
Numbers can hide judgment calls too. A high temperature of 81 degrees feels precise, but it may represent a rounded estimate from model data, local adjustment, and forecast experience. Wind speed, rainfall totals, and snowfall amounts often come with even more uncertainty because they depend on narrow bands, terrain, storm intensity, and small changes in track. A careful forecast may include ranges or probability language, but small screens tend to favor crisp answers.
The best way to read conflicting forecasts is to look for the shared signal. If several apps agree that the afternoon is unsettled, plan for possible rain even if the exact hour differs. If one app shows a major storm risk and others do not, check an official local forecast, radar, and any watches or warnings. For ordinary planning, disagreement is a reminder to think in ranges: warmer or cooler, earlier or later, wetter or drier, higher or lower confidence.
How to Use Disagreement Wisely
Forecast disagreement is not just a flaw. It is a clue. When apps agree closely, the atmosphere may be giving a strong signal. When they spread apart, the situation may be sensitive to timing, location, storm development, or model choice. That does not make the forecast useless. It means the forecast should be read as a decision aid, not a promise.
For low-stakes choices, one app may be enough. For outdoor events, travel, sports, school activities, or severe weather, it helps to compare an official local forecast, radar, and at least one other forecast source. Pay attention to update times, hourly trends, and whether the forecast uses words such as likely, possible, isolated, scattered, or widespread. Those words often carry more meaning than a single icon.
Weather apps disagree because forecasting is a careful translation from messy atmospheric evidence into simple public guidance. The atmosphere does not owe anyone a clean answer, especially days ahead or during fast-changing storms. A good reader of forecasts does not need to memorize every model. It is enough to notice uncertainty, compare signals, and leave room for the sky to change its mind.