 Akshay Dinesh
Water in a river is easy to see. Water held deep in an aquifer is not, and no network of wells can sample every basin on Earth. Yet that hidden water has mass, and mass changes gravity. Two pairs of satellites have turned that simple physical fact into a way of tracking groundwater loss, reservoir filling, melting ice, and other changes in the water stored on land.
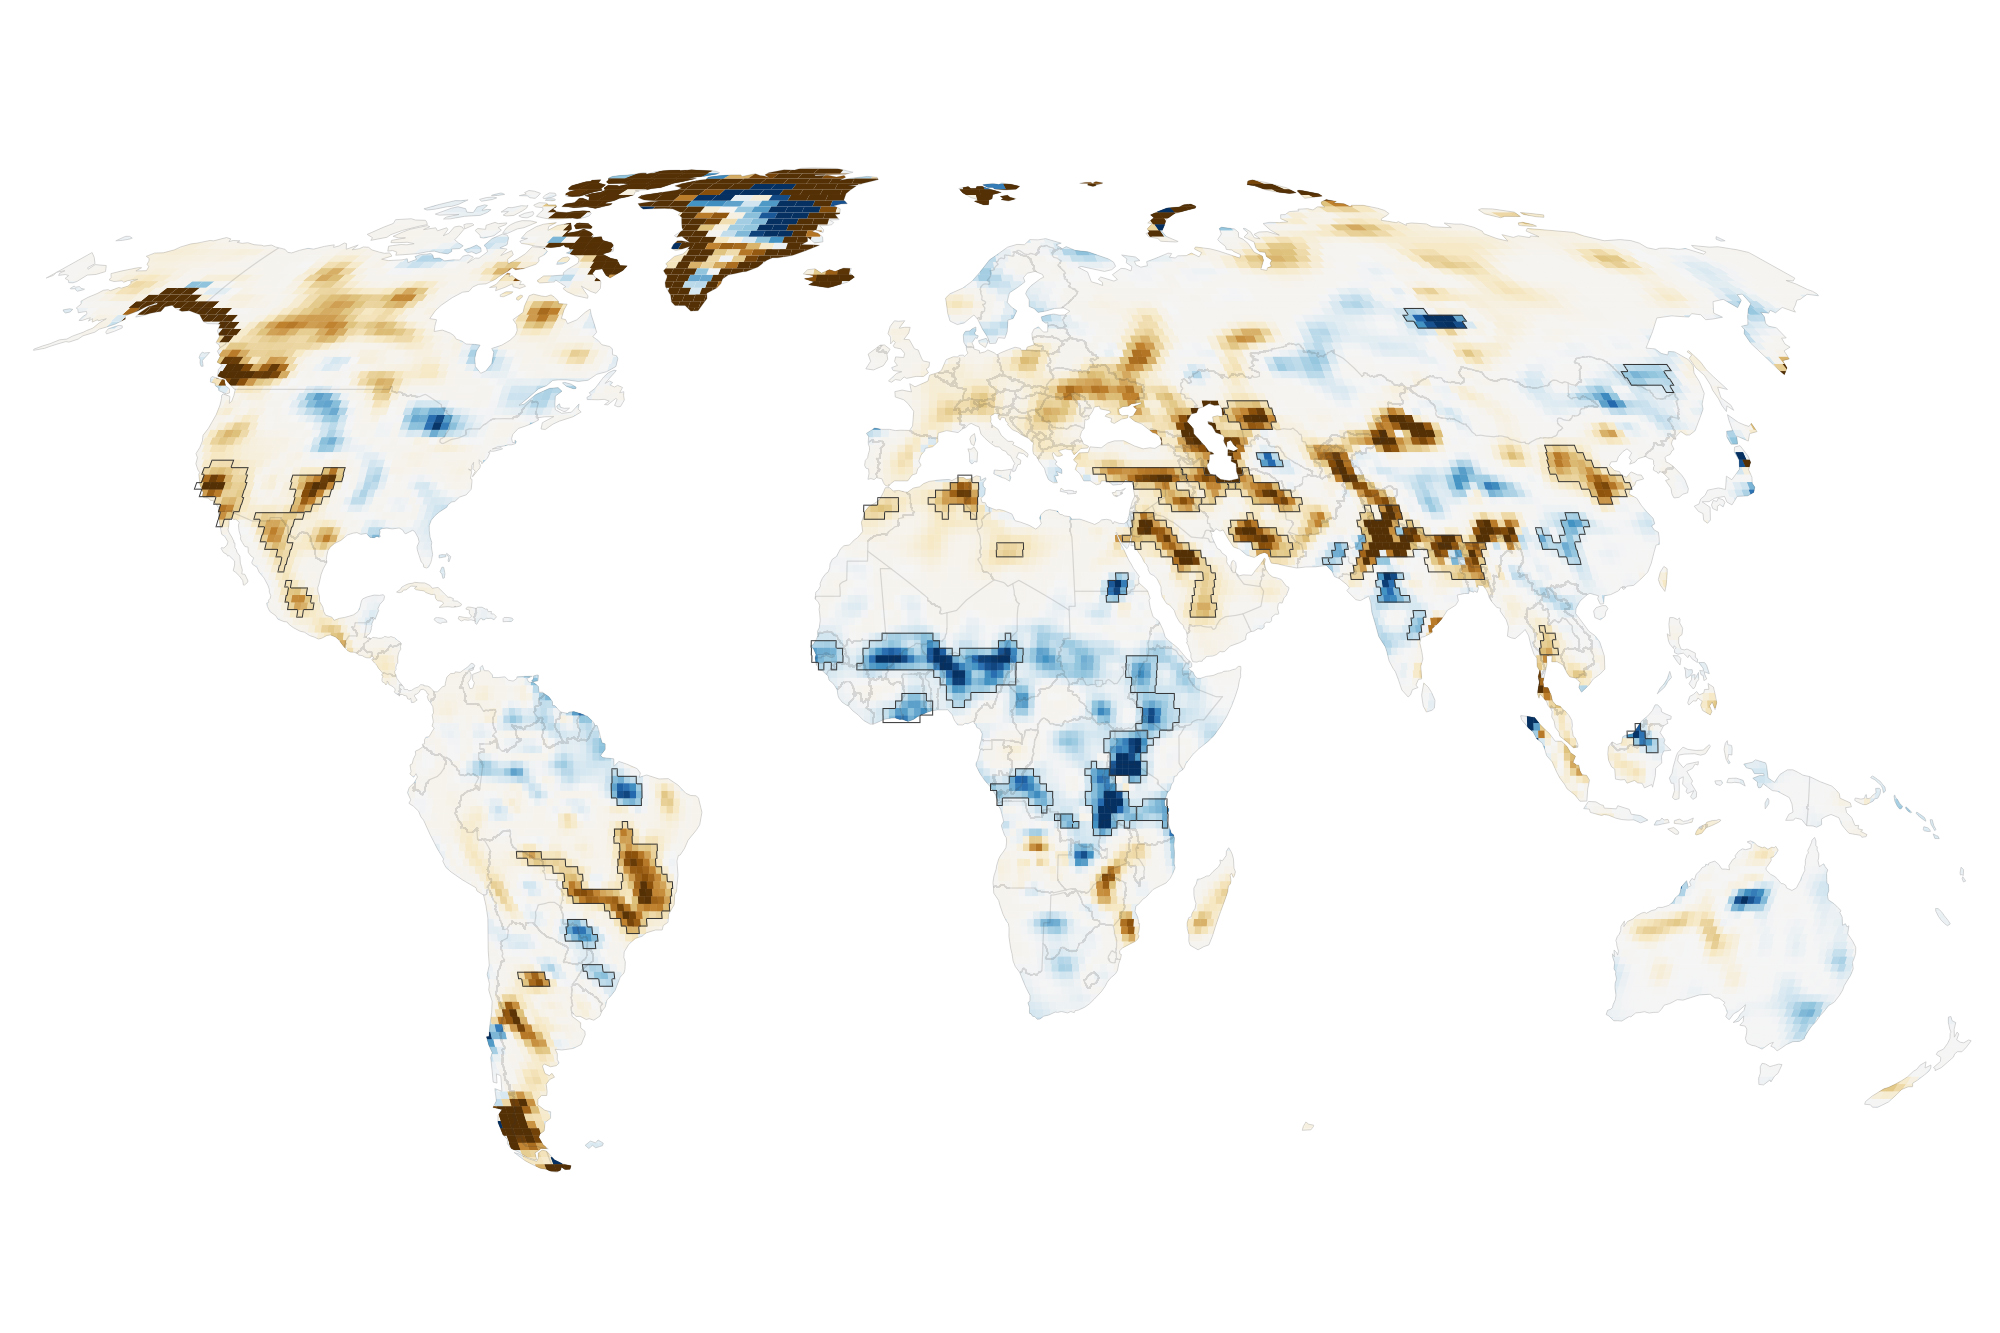
A 2026 study led by NASA hydrologist Mary Michael O’Neill used more than two decades of measurements from the GRACE and GRACE Follow-On missions to map these shifts in finer detail. The researchers found 40 regions where long-term storage trends were strongly associated with human activities such as irrigation, reservoir construction, and land-use change. The result is a more complicated picture than the familiar water-cycle diagram: people do not merely use water after it falls. At a large enough scale, our choices can change where water stays.
The water cycle has a human fingerprint
The natural water cycle moves water among the atmosphere, oceans, ice, rivers, soil, plants, and underground rock. Rain and snow recharge some stores; evaporation, runoff, and plant transpiration empty others. Climate patterns can shift the balance for months or years. A drought may lower rivers and soil moisture, while an unusually wet period can refill reservoirs and aquifers.
Human activity acts on many of the same stores. Farmers pump groundwater to irrigate crops. Engineers hold water behind dams or move it through canals. Cities draw from rivers and aquifers. Changes from forest or grassland to cropland can alter how much rainfall runs off, returns to the air through plants, or seeps underground. These effects can overlap with drought, rainfall, and temperature, which makes them difficult to separate.
The new analysis does not claim that people caused every change visible on its map. Instead, the researchers compared observed storage trends with climatic and human variables and asked which relationships were strongest. Human factors were significantly related to trends on every nonpolar continent except Australia. In four continental regions, a human variable had a stronger relationship with the trend than any climate variable in the analysis.
How twin satellites turn gravity into a water measurement
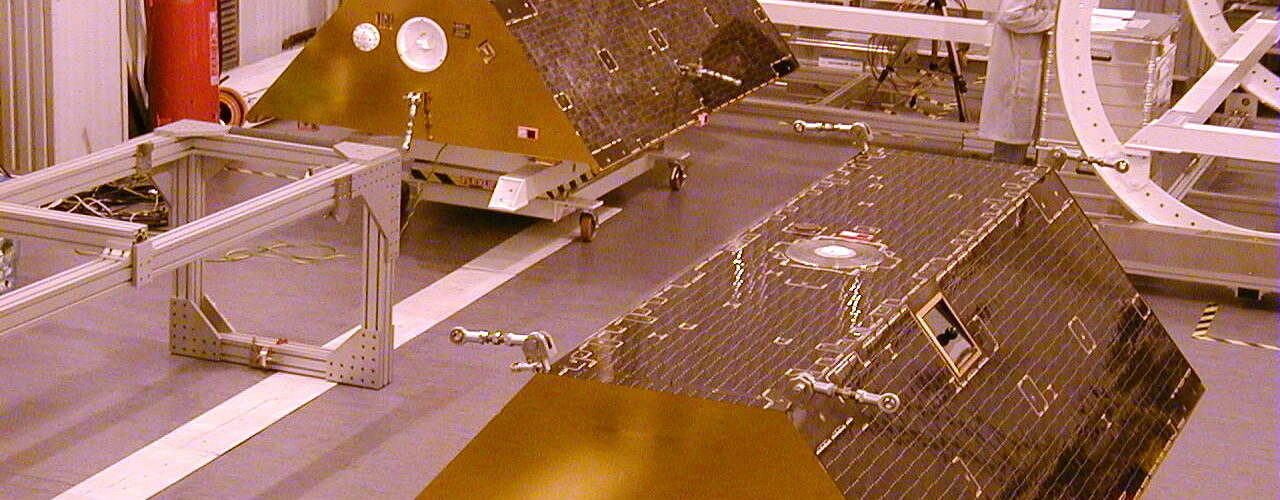
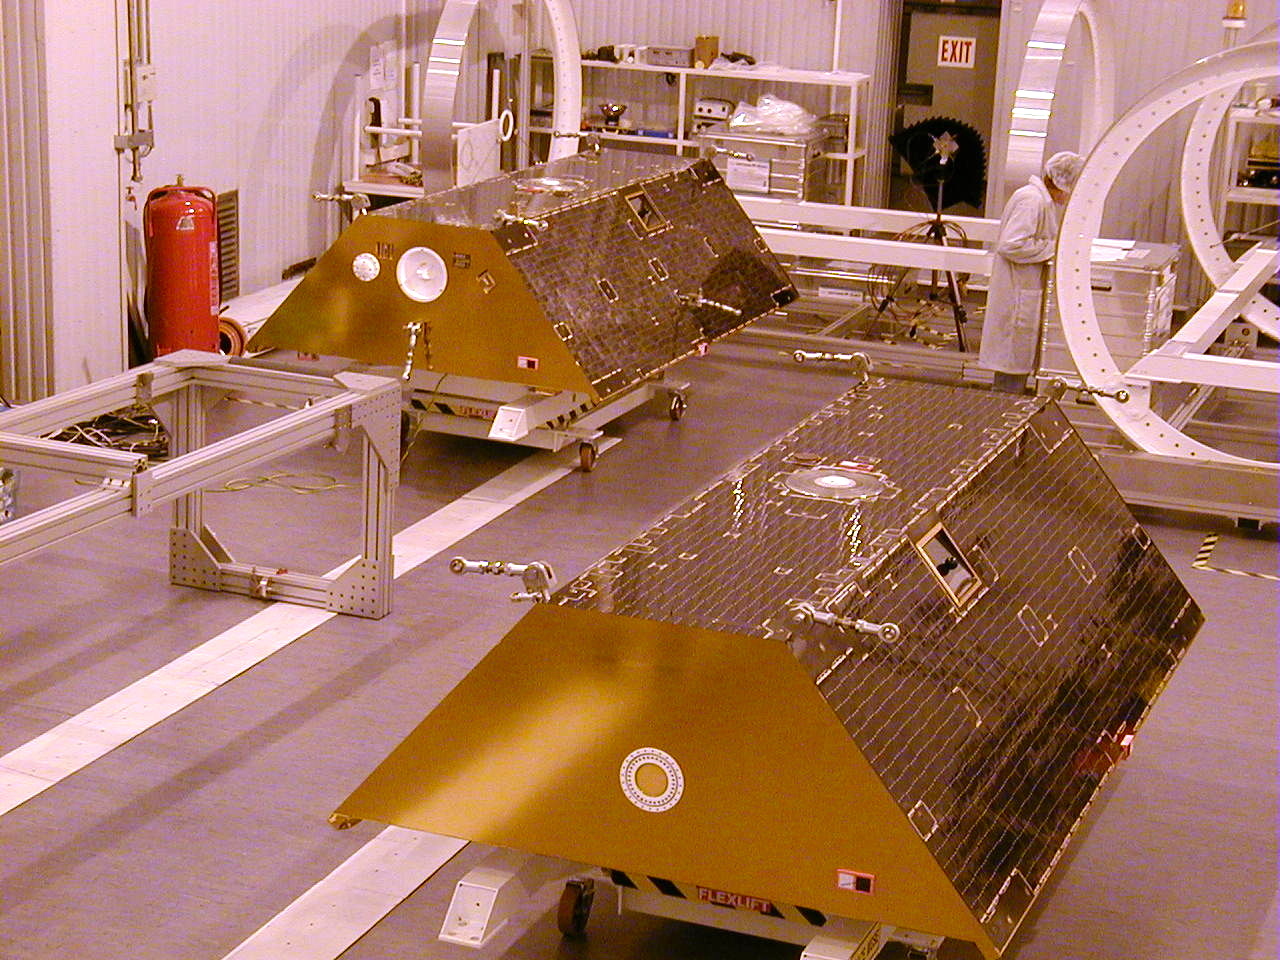
GRACE, short for Gravity Recovery and Climate Experiment, launched in 2002 as a joint U.S.-German mission. Its successor, GRACE Follow-On, continued the record beginning in 2018. Each mission uses two nearly identical satellites that travel around Earth in the same orbit, one following the other.
Their separation changes by tiny amounts. When the leading satellite approaches a region with slightly more mass beneath it, gravity pulls that spacecraft forward before the trailing satellite feels the same tug. A ranging system measures the changing distance between them with extraordinary precision. After accounting for the atmosphere and other forces, researchers can use those orbital changes to map variations in Earth’s gravity field.
Mountains and dense rock create lasting gravity differences, but water moves. A heavy snowpack can build during winter and melt in spring. Groundwater can decline during years of pumping. A new reservoir can add a large mass of water to one place. Repeated observations let scientists distinguish those changes from the planet’s more permanent features.
The satellites are therefore more like a scale than a camera. They do not look through the ground or take a picture of an aquifer. They sense a change in total mass across a broad area. Other observations and models are needed to decide how much of that change came from groundwater, soil moisture, lakes, rivers, snow, or ice.
What terrestrial water storage actually includes
Scientists call the combined water stored on and beneath land terrestrial water storage. It includes groundwater, soil moisture, snow, glaciers, lakes, rivers, wetlands, and reservoirs. That total is useful because it captures water that ordinary satellite photographs cannot see, especially underground. It also creates a challenge: GRACE can show that a region has gained or lost mass without identifying the responsible store on its own.
Imagine a farming basin during a dry year. Low rainfall may reduce soil moisture and surface water at the same time that farmers pump more groundwater. GRACE records the combined loss. Researchers then compare that signal with precipitation records, irrigation data, glacier estimates, land-cover maps, and hydrologic models to explain the pattern. The final interpretation depends on several lines of evidence, not on gravity data alone.
The 2026 study gained detail by combining repeated passes from April 2002 through November 2025. Its long-term maps were five to ten times more spatially refined than earlier GRACE analyses. That sharper view helped reveal smaller reservoirs and localized agricultural regions that broad monthly products could blur together. The tradeoff was time: combining many observations improves the long-term spatial pattern but loses some ability to follow rapid month-to-month changes.
Why the same human action can produce opposite results
Groundwater-irrigated farmland was strongly associated with declining water storage in several regions. The map shows losses in California’s Central Valley, the southern High Plains of the United States, Chihuahua in Mexico, and northern India. In places where drought reduces surface supplies, pumping often becomes more intense. Water that accumulated underground over long periods can then leave the basin through crops, rivers, or evaporation faster than it is replaced.
Northern India offered a particularly revealing case. The refined map showed a steeper decline than earlier estimates, while retreating Himalayan glaciers explained only about 15 percent of the regional loss. That leaves groundwater withdrawal as a major part of the story. The finding matters because wells can conceal scarcity for a while: fields may remain green even as the underground reserve falls.
Not every agricultural change produced a loss. Parts of sub-Saharan Africa gained water where rainfed cropland expanded into savanna, despite below-average precipitation. Northern Brazil’s Maranhão state showed a similar association where soybean fields replaced forests and shrublands. The study’s authors point to differences in plant water use and, in Brazil, practices that can direct water into shallow aquifers. These are associations that need local investigation, but they show why land-use effects cannot be reduced to a single rule.
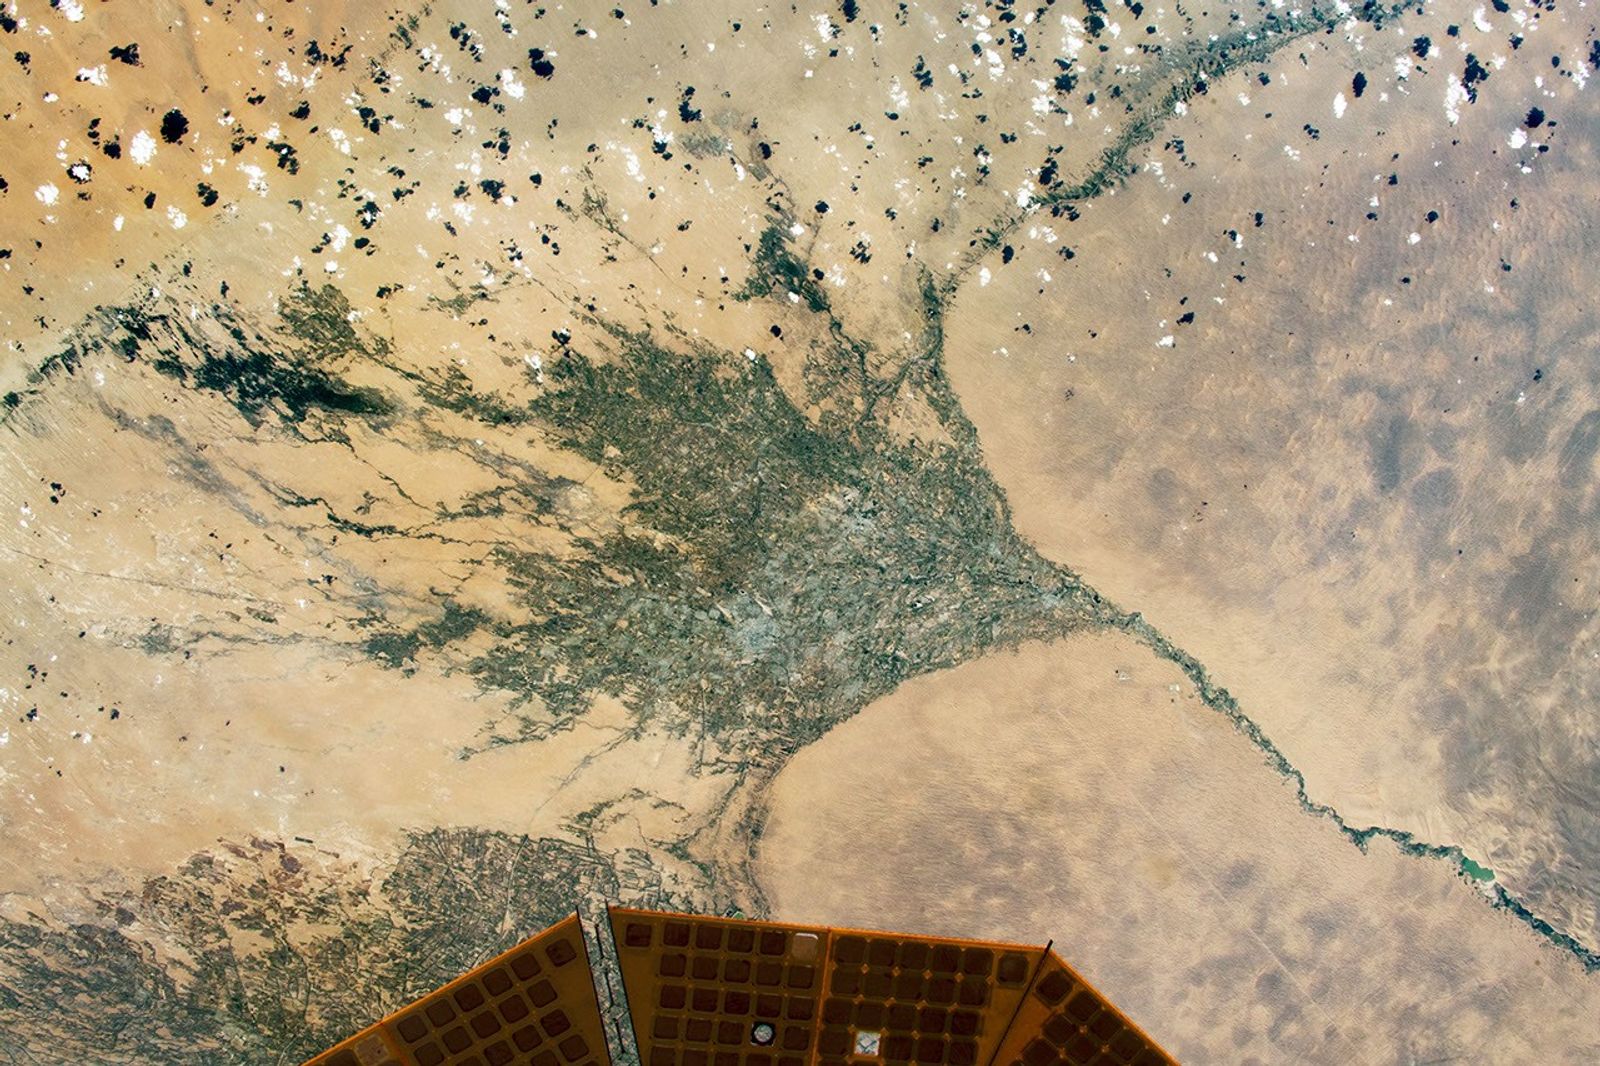
Large engineering projects leave another kind of signature. The filling of Russia’s Boguchany Reservoir produced the strongest storage trend in nonpolar northern Asia. In Turkmenistan, leakage from the long, largely unlined Karakum Canal adds water to the desert subsurface as the canal carries river water toward farms. A project built to move water across the surface can therefore change groundwater along its route.
What the map can tell us, and what it cannot
The map is valuable because it applies one measurement system across much of the world. Well records are often sparse, inconsistent, or unavailable across borders. Gravity measurements can expose a broad storage trend in remote regions and help scientists decide where closer monitoring is needed. They can also show whether a local-looking decision has grown large enough to alter the water balance of an entire region.
Still, a statistical relationship is not the same as a complete account of cause and effect. Irrigation, land cover, rainfall, temperature, reservoirs, and water policy can influence one another. A coarse regional total can also hide differences among individual aquifers or communities. Ground measurements remain essential for judging water quality, well depth, recharge rates, and who has access to the remaining supply.
The time scale matters too. A long-term decline does not mean that every year was dry, and a storage gain does not automatically mean that water management is sustainable. A leaking canal may recharge shallow groundwater while also wasting scarce river water. A reservoir may increase storage in one location while changing flows and ecosystems downstream. The next research challenge is to connect these local and distant effects and to recover more of the timing behind them.
A planetary scale with local consequences
Gravity satellites make an invisible resource easier to see. Their measurements show that groundwater pumping, dams, canals, and changes in vegetation can leave a physical signal large enough to detect from orbit. That does not turn a global map into a local water budget, but it gives communities and researchers a powerful warning system: water can disappear beneath a productive landscape long before the surface looks empty.
The strongest use of this information is not simply to label regions as gaining or losing water. It is to ask why the change is happening, which store is affected, whether it can recover, and who depends on it. The water cycle is still driven by the Sun, weather, and gravity. It now also carries the measurable imprint of human decisions.