Akshay Dinesh
A winter outlook can look more certain than it really is. A broad swath of orange on a temperature map may seem to promise a mild season, while green on a precipitation map can be mistaken for a snow forecast. NOAA’s 2026-27 U.S. Winter Outlook does neither. It describes how the odds of three seasonal outcomes have shifted, averaged across December, January, and February, and it leaves plenty of room for cold snaps, dry weeks, heavy storms, and sharp local differences.
The outlook matters because a very strong El Niño is expected to influence the coming winter. NOAA favors warmer-than-average seasonal temperatures across much of the northern United States and wetter-than-average conditions across the southern tier and East Coast. Those are useful signals for water managers, farmers, emergency planners, utilities, and households, but only when the maps are read as probability statements rather than scripts for each day.
A seasonal outlook is a map of odds
Weather forecasts and climate outlooks answer different questions. A seven-day forecast might estimate the temperature at a particular time and the chance of precipitation at a particular place. A three-month outlook asks whether the average temperature or total precipitation for an entire season is more likely to finish in the upper, middle, or lower third of the historical record.
NOAA’s Climate Prediction Center compares each location with its own 1991-2020 climate record. The warmest third of past winters is labeled above normal, the middle third is near normal, and the coolest third is below normal. Precipitation is divided the same way, using the wettest, middle, and driest thirds. A winter can land in the above-normal temperature category without being warm every day; a few intense cold waves may still occur inside a mild seasonal average.
The percentages printed on the map show confidence in a category, not the size of the expected departure from normal. Darker orange means a higher probability that the seasonal average will fall in the warmest third. It does not necessarily mean a place will be many degrees warmer than an area shaded light orange. The categories also use local climate, so an above-normal winter in Minnesota remains much colder than an above-normal winter in Florida.
What “equal chances” really means
White areas marked EC are often misunderstood as a forecast for average conditions. They actually mean equal chances: forecasters do not have enough evidence to favor above-normal, near-normal, or below-normal conditions over the others. Each category begins with a climatological probability of about one-third. Competing climate signals, weak model agreement, or limited predictability can leave those odds close to 33.3 percent each.
Suppose a map gives one region a 50 percent chance of above-normal temperature. That category is favored, but the combined chance of a near-normal or below-normal season is still 50 percent. “Favored” is not the same as “guaranteed.” A forecast can be well constructed and still see the less likely category occur, just as a fair six-sided die can land on a particular number even though another group of outcomes was more probable.
Near-normal is also a defined category, not a promise that every week will feel ordinary. A winter with an unusually warm December and a bitter February could average into the middle third. Seasonal averaging smooths the sequence that people actually experience, which is why the map cannot tell anyone when a disruptive storm or cold spell will arrive.
What NOAA favors for winter 2026-27
For December 2026 through February 2027, NOAA favors above-normal seasonal temperatures across much of the northern United States, including the Pacific Northwest, northern Rockies, Midwest, Mississippi Valley, and much of the East. Alaska is also broadly tilted toward warmth. Parts of the Southeast, including Florida, lean closer to near-normal, while much of the Southwest has equal chances rather than a clear temperature signal.
The precipitation map has a different pattern. Wetter-than-normal conditions are favored across much of the southern tier, from the Southwest through the southern Plains and Southeast, and along the East Coast. Parts of the northern Rockies, Great Lakes, Alaska, and Hawaii lean drier. Large areas in between have equal chances, meaning the outlook does not favor the wet, middle, or dry category.
Temperature and precipitation categories should not be combined mechanically into a snow prediction. Above-normal precipitation can arrive as rain, snow, ice, or a mixture, depending on temperatures during individual storms. A region can also receive near-normal total precipitation through one major event followed by long dry stretches. NOAA explicitly notes that the winter outlook does not project seasonal snowfall totals, because snowfall depends on storm tracks and temperature details that generally cannot be predicted reliably months ahead.
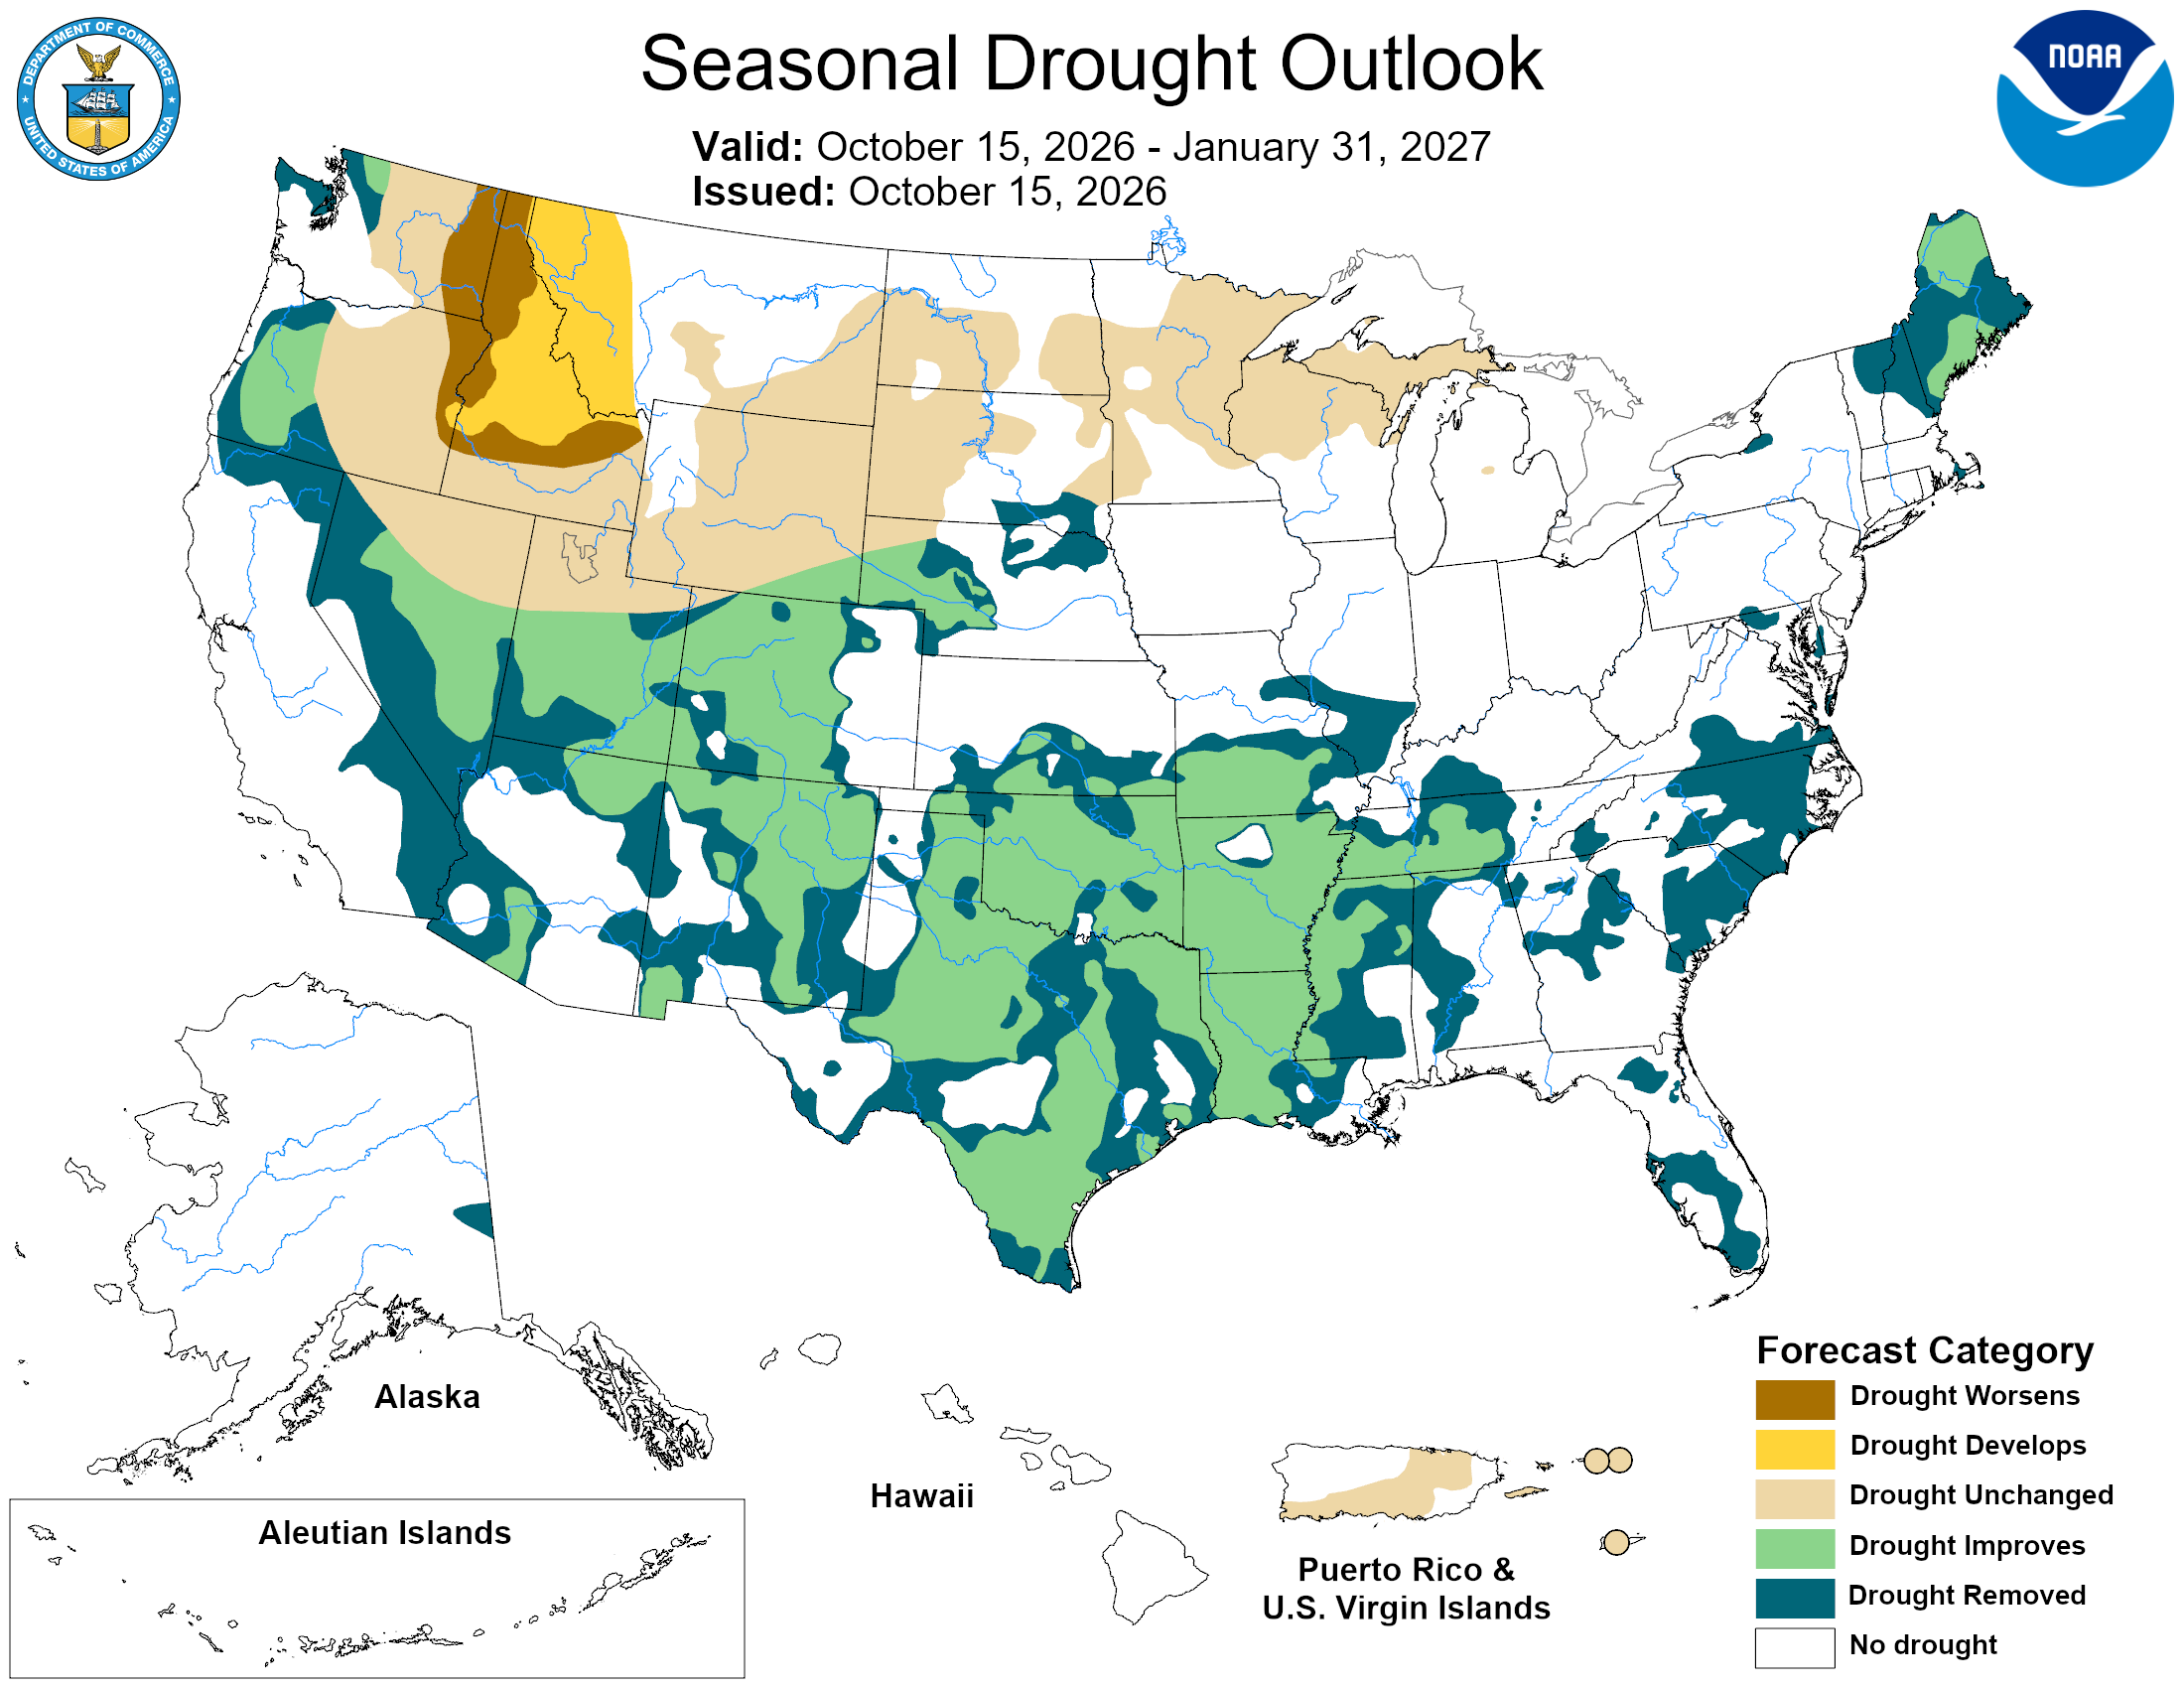
The accompanying drought outlook translates the climate signal into another question: where might existing drought improve, persist, or worsen? NOAA expects improvement or an end to drought in much of the Southwest, southern Great Plains, Southeast, and parts of the East Coast by the end of January. Development or worsening is favored in parts of the northern Rockies and the inland Northwest. That map is not simply a recolored precipitation outlook; current soil moisture, water deficits, seasonal demand, and the amount of precipitation needed for recovery all matter.
Why El Niño tilts the winter pattern
El Niño begins with unusually warm water across the central and eastern tropical Pacific, but the ocean anomaly is only one part of the event. Tropical rainfall shifts eastward, large-scale air circulation changes, and the Pacific jet stream often strengthens and moves south and east. In the United States, that pattern commonly directs more winter storms toward California, the southern Plains, the Gulf Coast, and the Southeast while leaving parts of the northern tier warmer or drier.
The Climate Prediction Center reported in October that El Niño was continuing to strengthen, with a strong-to-very-strong event likely through January-March 2027. Forecasters used that signal alongside the North American Multi-Model Ensemble, other dynamical and statistical models, recent climate trends, coastal ocean temperatures, the Pacific Decadal Oscillation, and the Quasi-Biennial Oscillation. Agreement among several tools raises confidence in some regions, especially the wet signal in the Southeast. Where the tools disagree, the map stays closer to equal chances.
Even a powerful El Niño does not produce the same outcome every time. The atmosphere is affected by other patterns operating over days, weeks, and decades. A shifted storm track can miss a particular city, and small temperature differences can determine whether a storm brings rain or snow. Historical El Niño winters are evidence about tendencies, not templates that the atmosphere must copy.
How to use the outlook without overreading it
A seasonal outlook is most useful for decisions that can work with ranges and probabilities. A water manager may watch whether the favored wet pattern begins to refill reservoirs. A utility can prepare for a season that leans mild while preserving plans for peak demand during cold outbreaks. Farmers and emergency managers can combine the outlook with local drought, flood, and soil information. None of them should treat the map as a substitute for shorter-range forecasts.
For everyday planning, three habits keep the outlook in perspective:
- Read the valid period. The headline winter outlook covers the average or total across three months, not the next storm.
- Read the legend before the color. Shading represents the probability of a category, not the number of degrees, inches of precipitation, or inches of snow.
- Update as the season approaches. NOAA issues new three-month outlooks each month, while local National Weather Service forecasts become far more specific within days of an event.
The same principle applies to the new probabilistic precipitation tools available for the 2026-27 season. As a storm enters forecast range, those products can show low-end, expected, and high-end amounts of rain, ice, or snow. Watches and warnings then address hazards with much greater detail than any seasonal map can provide.
The 2026-27 outlook offers a coherent national signal: a very strong El Niño tilts much of the North toward a warmer seasonal average and much of the South and East toward wetter conditions. Its value lies in showing how risk has shifted, not in erasing uncertainty. Read that way, the maps become more useful, because they tell people what can be planned months ahead and what must wait for the forecast to come into focus.