 Akshay Dinesh
El Niño is not labeled “very strong” because one weather map looks dramatic or one storm season feels unusual. The label comes from measurements in the tropical Pacific, especially the temperature of ocean water near the equator, and from evidence that the atmosphere is responding to that ocean pattern. A strong event can influence rainfall, jet streams, drought risk, marine life, and hurricane patterns, but the classification starts with something more precise: how far sea surface temperatures depart from average in a specific region of the Pacific.
That distinction matters in 2026 because official climate monitors are watching an El Niño that has been strengthening quickly. NOAA’s Climate Prediction Center reported on August 13, 2026, that El Niño had a greater than 90 percent chance of becoming very strong during the Northern Hemisphere fall and winter of 2026-27. The same discussion noted a 69 percent chance that the October-December 2026 season could qualify as a historic event, based on a three-month Relative Oceanic Niño Index value of at least +2.5 degrees Celsius. Those numbers can sound startling, but they are easier to understand when the measurement system is clear.
The Ocean Region Forecasters Watch Closely
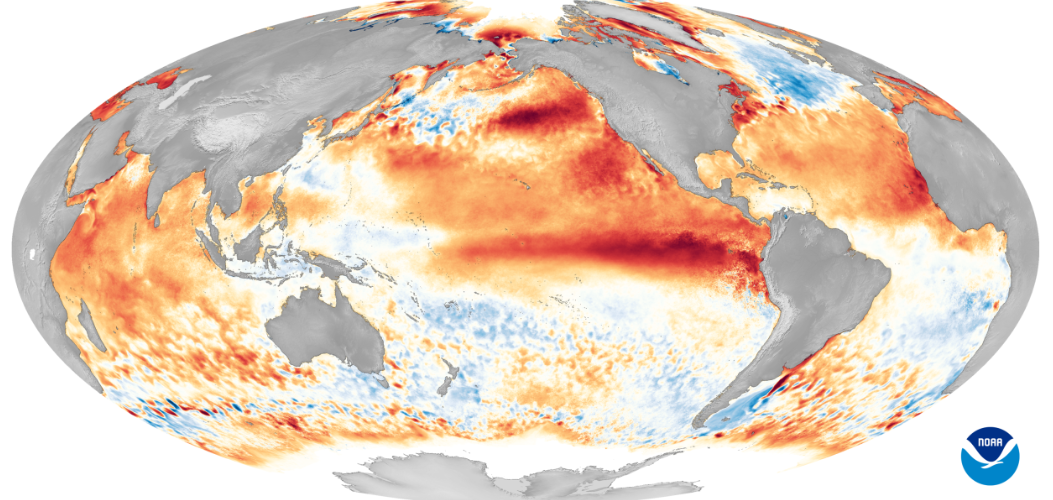
The main monitoring area for El Niño strength is called Niño 3.4. It sits along the equator in the central-eastern tropical Pacific, between about 5 degrees north and 5 degrees south latitude and from 170 degrees west to 120 degrees west longitude. That may sound like a narrow strip on a globe, but it covers a huge stretch of ocean where small temperature shifts can change the placement of tropical thunderstorms and winds.
Forecasters compare the sea surface temperature in that region with a long-term average for the same time of year. If the water is warmer than average by at least 0.5 degrees Celsius for long enough, and the atmosphere shows the right response, El Niño conditions can be present. Bigger departures suggest a stronger event. In NOAA’s August 2026 strength-probability table, the very strong category begins when the index reaches at least +2.0 degrees Celsius, while a historic threshold is discussed at +2.5 degrees Celsius or higher for the three-month Relative Oceanic Niño Index.
That does not mean the whole Pacific is uniformly hot or that every ocean basin behaves the same way. The point is to measure a region that has proved especially useful for tracking the El Niño-Southern Oscillation, often shortened to ENSO. A named region gives forecasters a consistent yardstick, so they are not judging each event by impressions, headlines, or local weather impacts.
Why Temperature Alone Is Not Enough
Warm water is the starting signal, but El Niño is more than a patch of warm ocean. It is an ocean-atmosphere pattern. During a developing El Niño, the usual east-to-west trade winds along the equator weaken, warm water spreads eastward, and deep thunderstorm activity shifts across the tropical Pacific. Those changes affect pressure patterns and high-altitude winds, which is how an equatorial ocean event can eventually shape seasonal forecasts far away.
That is why NOAA’s August 2026 discussion did not rely only on surface temperature. It also pointed to westerly wind anomalies near the surface, easterly wind anomalies higher in the atmosphere, enhanced rainfall over the central and eastern Pacific, and suppressed rainfall over Indonesia. The discussion also reported significantly negative Southern Oscillation values during July, another sign that the atmosphere was responding to the ocean warming.
Subsurface heat adds another clue. Water below the surface can supply warmth to the upper ocean later, especially when winds and currents help bring that heat upward. NOAA described significant subsurface temperature anomalies in July 2026, reaching around +10.0 degrees Celsius at depth in parts of the equatorial Pacific. IRI’s August 19, 2026, update also described a large reservoir of warm subsurface water across the central-eastern equatorial Pacific. That kind of stored heat can help explain why forecasters may expect an event to keep strengthening rather than level off quickly.
What “Very Strong” Means in Practice
The phrase “very strong El Niño” sounds like a weather warning, but it is really a classification of climate-pattern strength. NOAA’s strength probabilities use temperature-departure thresholds for overlapping three-month seasons. A value of +0.5 to +1.0 degrees Celsius falls in the weak El Niño range, +1.0 to +1.5 is moderate, +1.5 to +2.0 is strong, and +2.0 or higher is very strong. The exact tables can use the Relative Oceanic Niño Index, which adjusts the comparison to account for broader tropical temperature changes.
This three-month approach smooths out short jumps and dips. One unusually warm week does not define the whole event. Forecasters look for persistence because ENSO is a seasonal climate pattern, not a day-to-day weather fluctuation. That is also why forecast charts use labels such as JAS, ASO, SON, and OND: each abbreviation stands for an overlapping three-month season, such as July-August-September or October-November-December.
In the August 2026 NOAA table, the probability of the very strong category was highest from late summer into winter. The table showed a 93 percent chance for September-November, a 95 percent chance for October-December, and a 90 percent chance for November-January. Those are probabilities, not final measurements. They tell readers that the forecast guidance is strongly tilted toward a very strong event, while still leaving room for the ocean-atmosphere system to develop differently from expected.
Why Forecast Models and Human Judgment Both Matter
ENSO forecasts blend observations, computer models, and expert judgment. Observations show what is happening now: sea surface temperature, subsurface heat, winds, cloudiness, rainfall, and pressure patterns. Models then project how those connected pieces may evolve over the coming seasons. Different models can disagree because they represent the ocean and atmosphere in different ways, start from slightly different conditions, or handle uncertainty differently.
IRI’s August 2026 update showed unusually strong model agreement. It reported that the 2026 El Niño continued to intensify, with the July monthly Niño 3.4 value reaching +2.03 degrees Celsius and the weekly value centered on August 12 reaching +2.7 degrees Celsius. Its model discussion said the signal was strongest for October-November-December 2026, when most models placed Niño 3.4 in the very strong category. That kind of agreement does not remove uncertainty, but it makes the forecast more compelling than a forecast based on one model run.
Human forecasters still play an important role. They know the models’ past strengths and weaknesses, compare new output with recent observations, and judge whether the ocean and atmosphere are truly coupled. NOAA explains that its official outlook is produced by a small team using model guidance, climate reanalysis, in situ measurements, and satellite data. In practice, that means the final forecast is not a mechanical reading of one chart. It is a careful synthesis of several lines of evidence.
Why a Stronger El Niño Does Not Guarantee Local Impacts
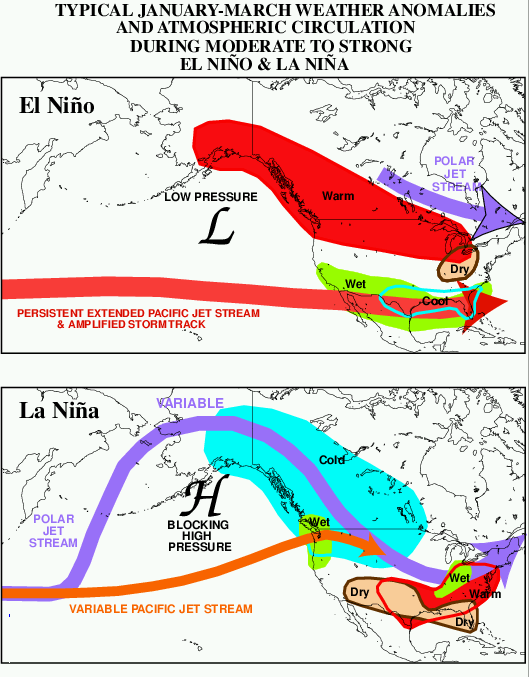
A very strong El Niño raises the chance that classic El Niño impacts will appear, but it does not guarantee them in every place. This is one of the easiest parts of climate forecasting to misunderstand. Seasonal outlooks are built around probabilities. They may say a region has higher odds of above-average rain, warmer temperatures, or a quieter Atlantic hurricane pattern, but they do not script the weather for any single city or week.
The reason is that El Niño is one large influence among many. Snow cover, soil moisture, ocean temperatures outside the tropical Pacific, Arctic air patterns, regional pressure systems, and ordinary weather variability can all change what people experience locally. A strong El Niño winter can still have dry spells in a wetter-favored region. A season with reduced Atlantic hurricane activity can still produce a dangerous storm. Stronger signals help forecasters lean more confidently toward certain outcomes, but confidence is not the same thing as certainty.
The strength label is still useful because it tells readers how much energy the Pacific pattern may be adding to the climate system. A weak event may barely tilt the odds in some regions. A very strong event is more likely to stand out in seasonal patterns, especially when the atmosphere is clearly linked to the ocean warming. The responsible way to read the label is not “this exact impact will happen,” but “the climate background has shifted strongly enough that seasonal risks deserve attention.”
How to Read El Niño Updates Without Overreacting
When a forecast says El Niño may become very strong or historic, start by asking what index is being used, what season is being discussed, and whether the number is observed or forecast. A weekly Niño 3.4 value can show recent intensity, but a three-month seasonal index is more important for classifying the event. A model probability can be highly informative, but it is still a forecast until the season has passed and the observations are complete.
It also helps to separate strength from impact. The temperature anomaly in the tropical Pacific describes the climate pattern itself. The effects depend on how that pattern interacts with the atmosphere and with regional conditions. NOAA’s own strength-probability page makes this point carefully: stronger ENSO events often come with higher confidence in expected impacts, but strength does not automatically determine the size of every impact.
That careful language is not hedging for its own sake. It is how scientific forecasting stays honest. El Niño classifications give learners a way to connect ocean measurements with weather probabilities, but they also teach a bigger lesson about evidence. A single dramatic phrase is less useful than the chain behind it: where the ocean is warm, how long the warmth lasts, whether the winds and rainfall agree, what the models show, and how forecasters translate all of that into probabilities. A very strong El Niño is serious because the evidence lines up, not because the label sounds dramatic.