A world map looks simple until you compare it with a globe. Greenland may seem almost as large as Africa on one classroom map, while another map makes Africa look far larger and Greenland more modest. Flight paths that seem curved on a wall map may be close to the shortest possible route on a globe. Even the familiar shapes of continents can stretch, squeeze, or bend depending on the map in front of you.
The reason is not that one mapmaker is careful and another is careless. The problem starts with geometry: Earth is roughly round, but paper and screens are flat. A map projection is the method used to transfer the curved surface of Earth onto a flat surface. That transfer can be done in many useful ways, but it cannot be done perfectly. Every world map has to give something up.
The Round-Earth Problem Every Flat Map Faces
Try peeling an orange and pressing the peel into one smooth rectangle. It tears, overlaps, or wrinkles because a curved surface does not flatten cleanly. Cartographers face the same kind of problem, only with oceans, continents, borders, and routes instead of orange peel. The U.S. Geological Survey explains the basic tradeoff plainly: showing all or part of a round Earth on a flat surface cannot happen without distortion.
A projection can preserve some qualities better than others. It may keep local shapes recognizable, keep areas in correct proportion, make compass directions easier to follow, or make distances accurate along selected lines. But it cannot preserve shape, area, distance, and direction everywhere at once. The mapmaker has to decide what the map is for before choosing which distortions are acceptable.
That is why a navigation chart, a classroom wall map, a weather map, and a population map may all use different projections. A sailor, a teacher, a pilot, a climate scientist, and a student comparing country sizes do not need the same kind of accuracy. A good map is not simply the one that looks most familiar. It is the one whose strengths match the question being asked.
Why the Mercator Projection Became So Familiar
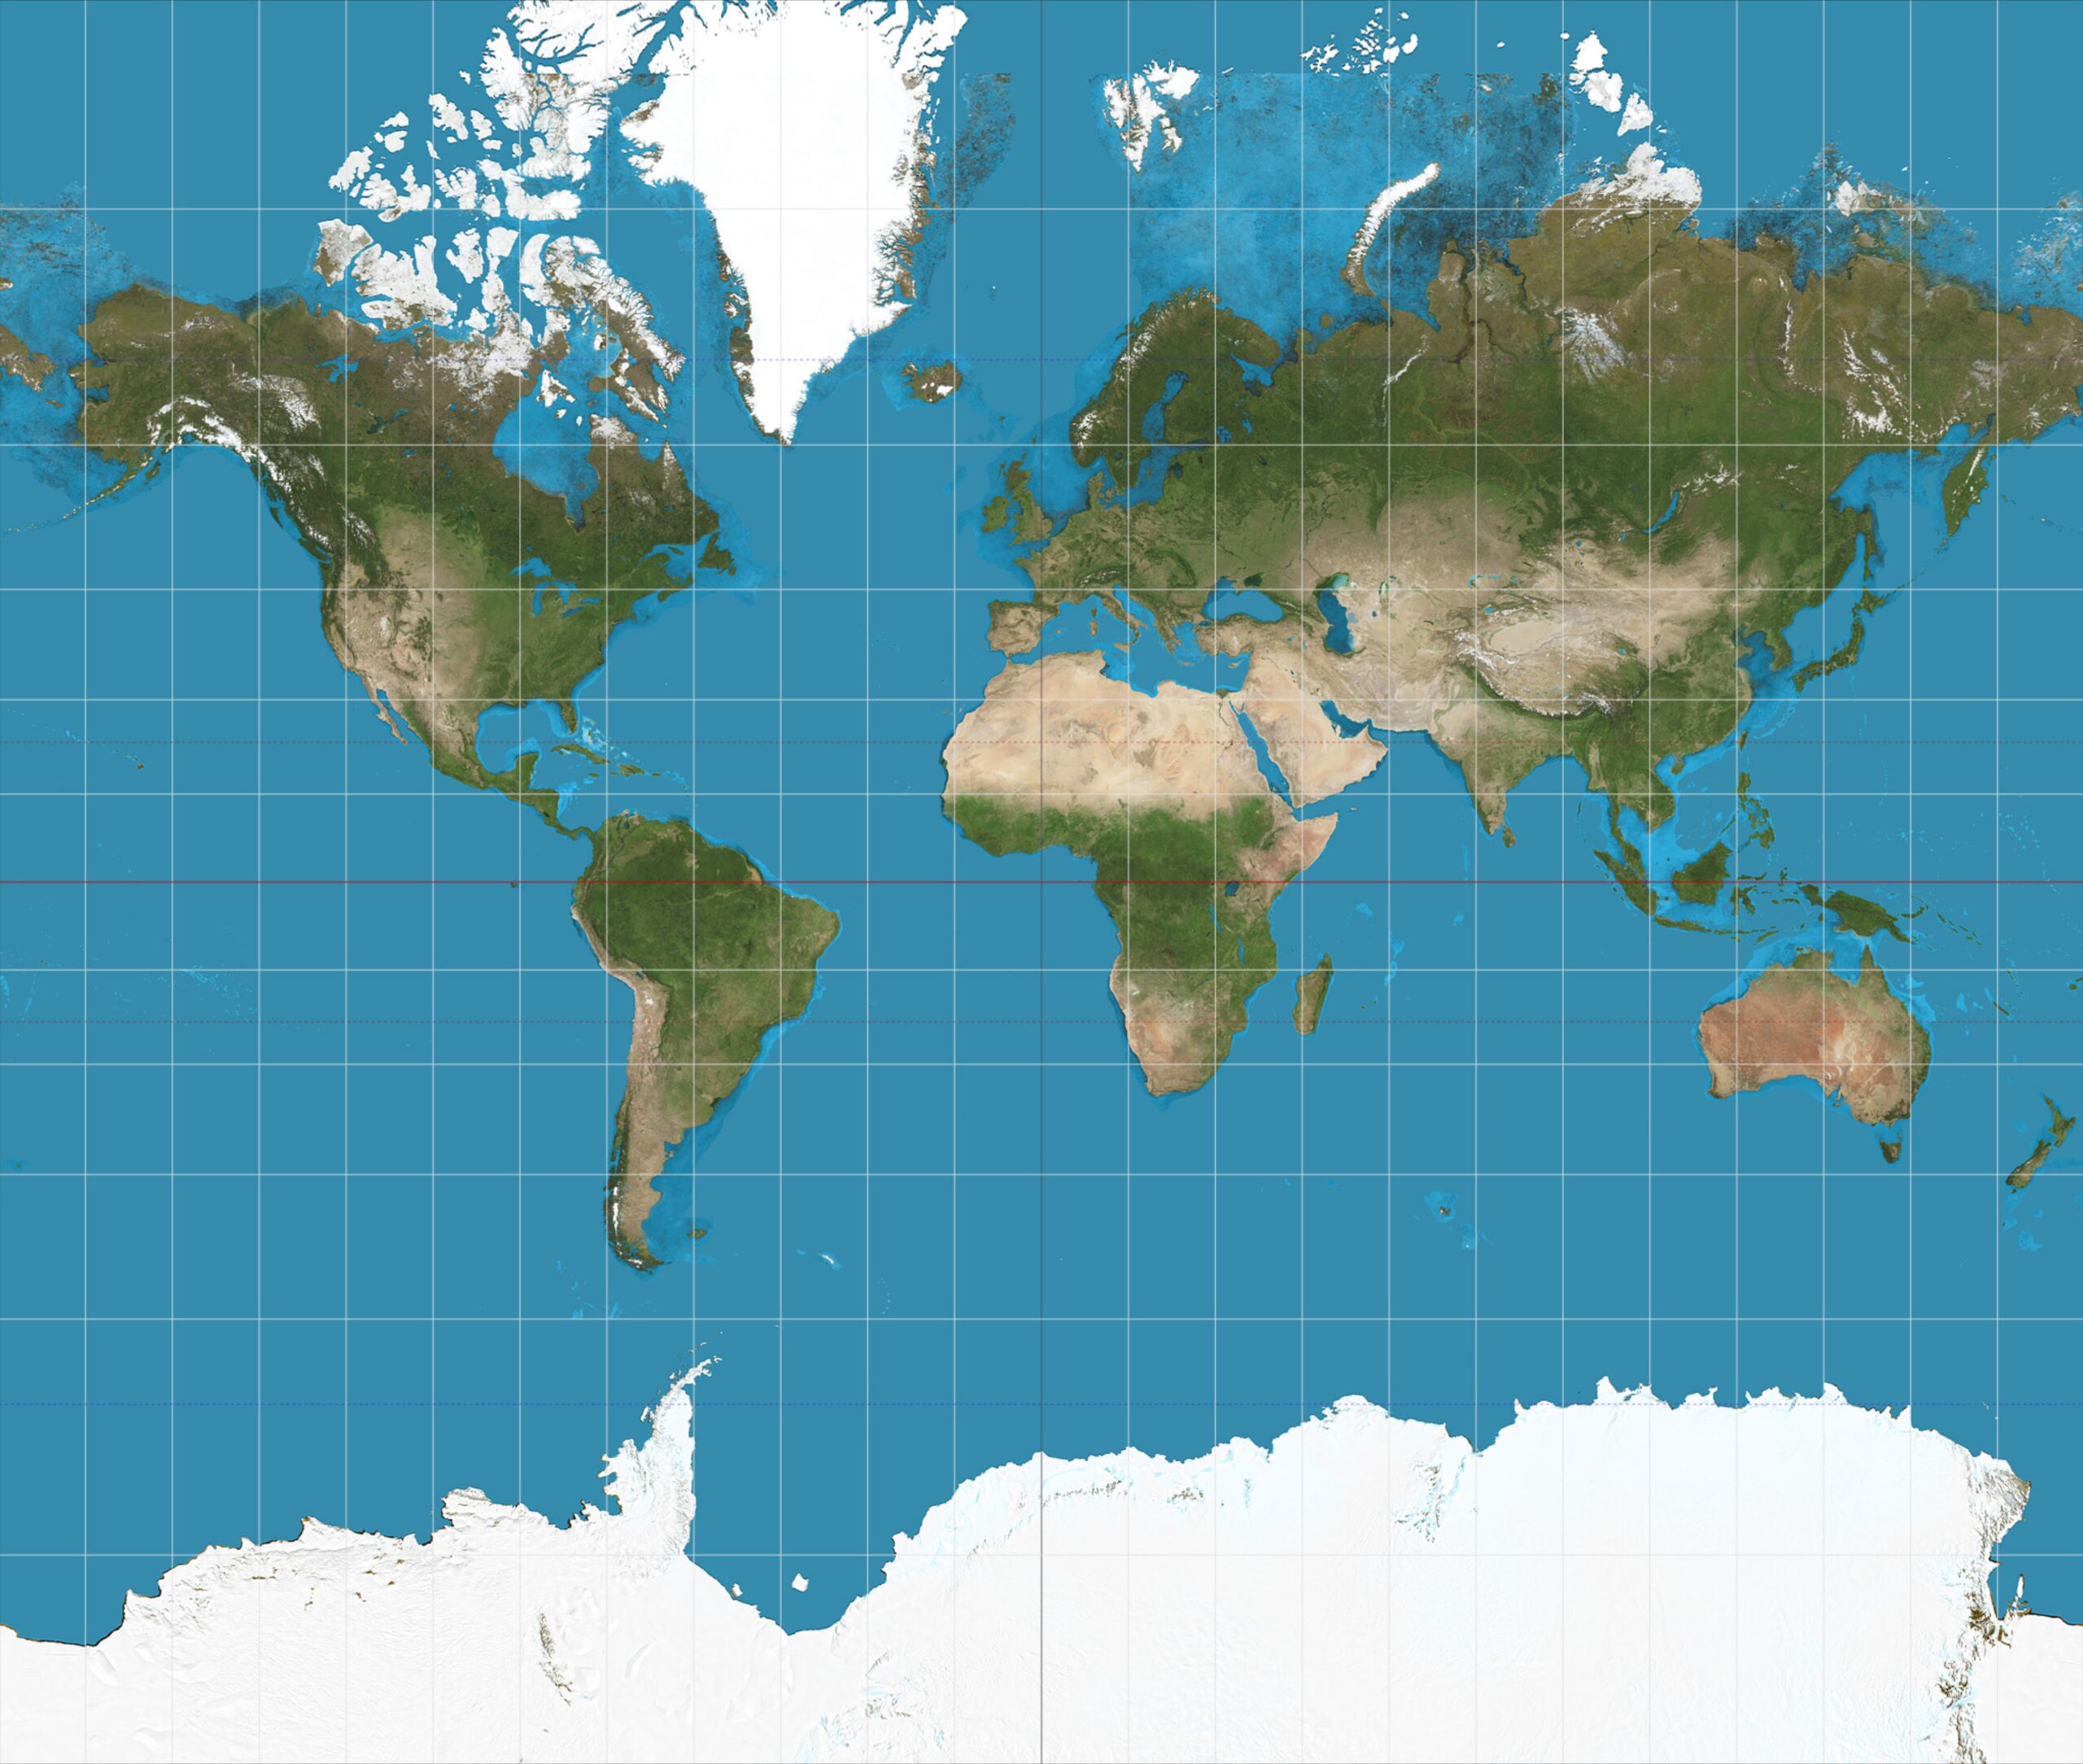
The Mercator projection, introduced by Gerardus Mercator in 1569, became famous because it solved a real navigation problem. On a Mercator map, a line of constant compass bearing can be drawn as a straight line. For sailors using a compass, that was extremely useful. A navigator could plot a course more easily than on many other world maps, especially before modern electronic navigation.
The same feature that helps with direction also creates the map’s best-known weakness. The Mercator projection stretches areas more and more as they move away from the Equator. Places near the poles become much too large compared with places near the tropics. Greenland, Canada, northern Europe, and Russia look oversized, while Africa, South America, and Southeast Asia look smaller than their actual share of Earth’s land.
This does not make the Mercator projection useless. It remains valuable in specific contexts, and a version of it became common in digital mapping because rectangular map tiles are convenient for zooming and panning. The trouble begins when people treat a Mercator world map as a neutral picture of country size. It is not neutral. It is a tool built around direction, and its area distortion is the price of that choice.
How Size Distortion Changes Mental Geography
Size on a map can quietly shape how people imagine the world. If a region looks large, it may feel more central or powerful. If it looks small, it may seem less significant, even when its real land area, population, or influence tells a different story. That is one reason debates about world maps can become emotional as well as technical.
National Geographic’s education materials often use Greenland as a clear example: on a Mercator map, Greenland can appear enormous because it sits far north, where the projection stretches the surface. Africa, closer to the Equator, is much less inflated. In reality, Africa is many times larger than Greenland. A reader who has only seen one projection may carry a distorted sense of relative size without realizing it.
The same issue affects comparisons across many regions. Alaska can look larger than Mexico on some maps even though Mexico has more land area. Europe may look closer in size to South America than it really is. Antarctica can become a long white band across the bottom of the map, exaggerated by its polar position. None of these impressions come from the land itself. They come from how the map chooses to flatten the globe.
Equal-Area and Compromise Maps Answer Different Questions
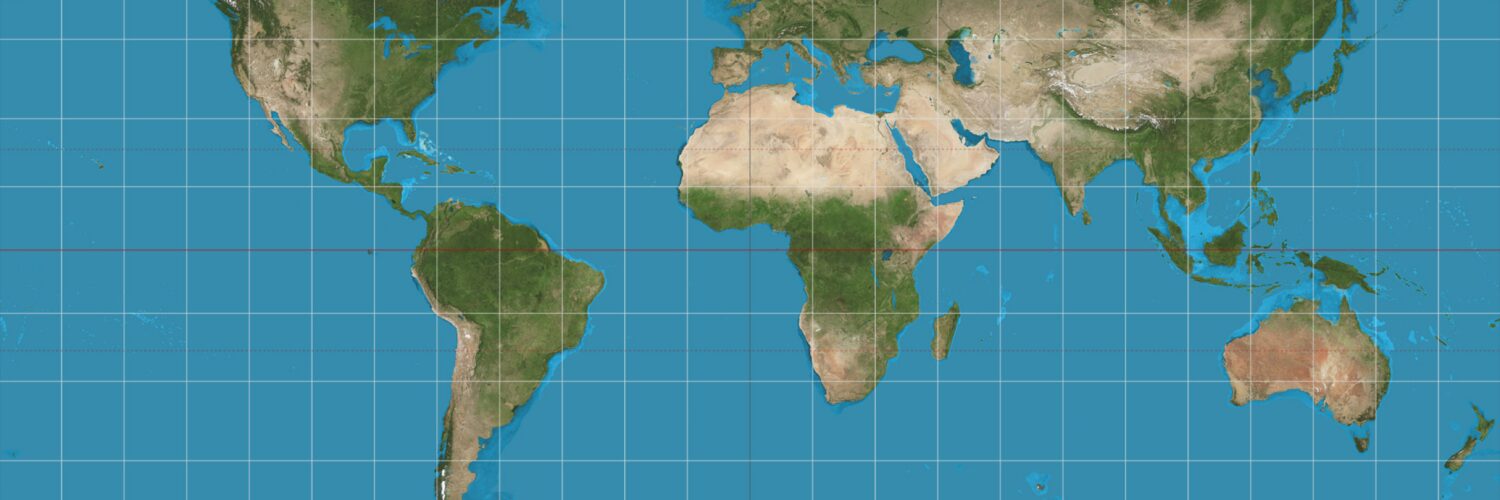
One response to Mercator’s size problem is to use an equal-area projection. Equal-area maps keep regions in correct proportion to one another. If one continent is twice the area of another, an equal-area map shows it as twice the area. That makes these projections especially helpful for comparing land area, population density, climate zones, forest cover, crop regions, or other data tied to surface size.
Equal-area maps pay for that accuracy in another way. They often distort shapes. Countries may look stretched vertically, widened, or curved in ways that feel unfamiliar. A reader may need a moment to recognize places that looked more familiar on a Mercator or Robinson-style wall map. The map has not made the world less accurate overall; it has simply chosen area over shape.
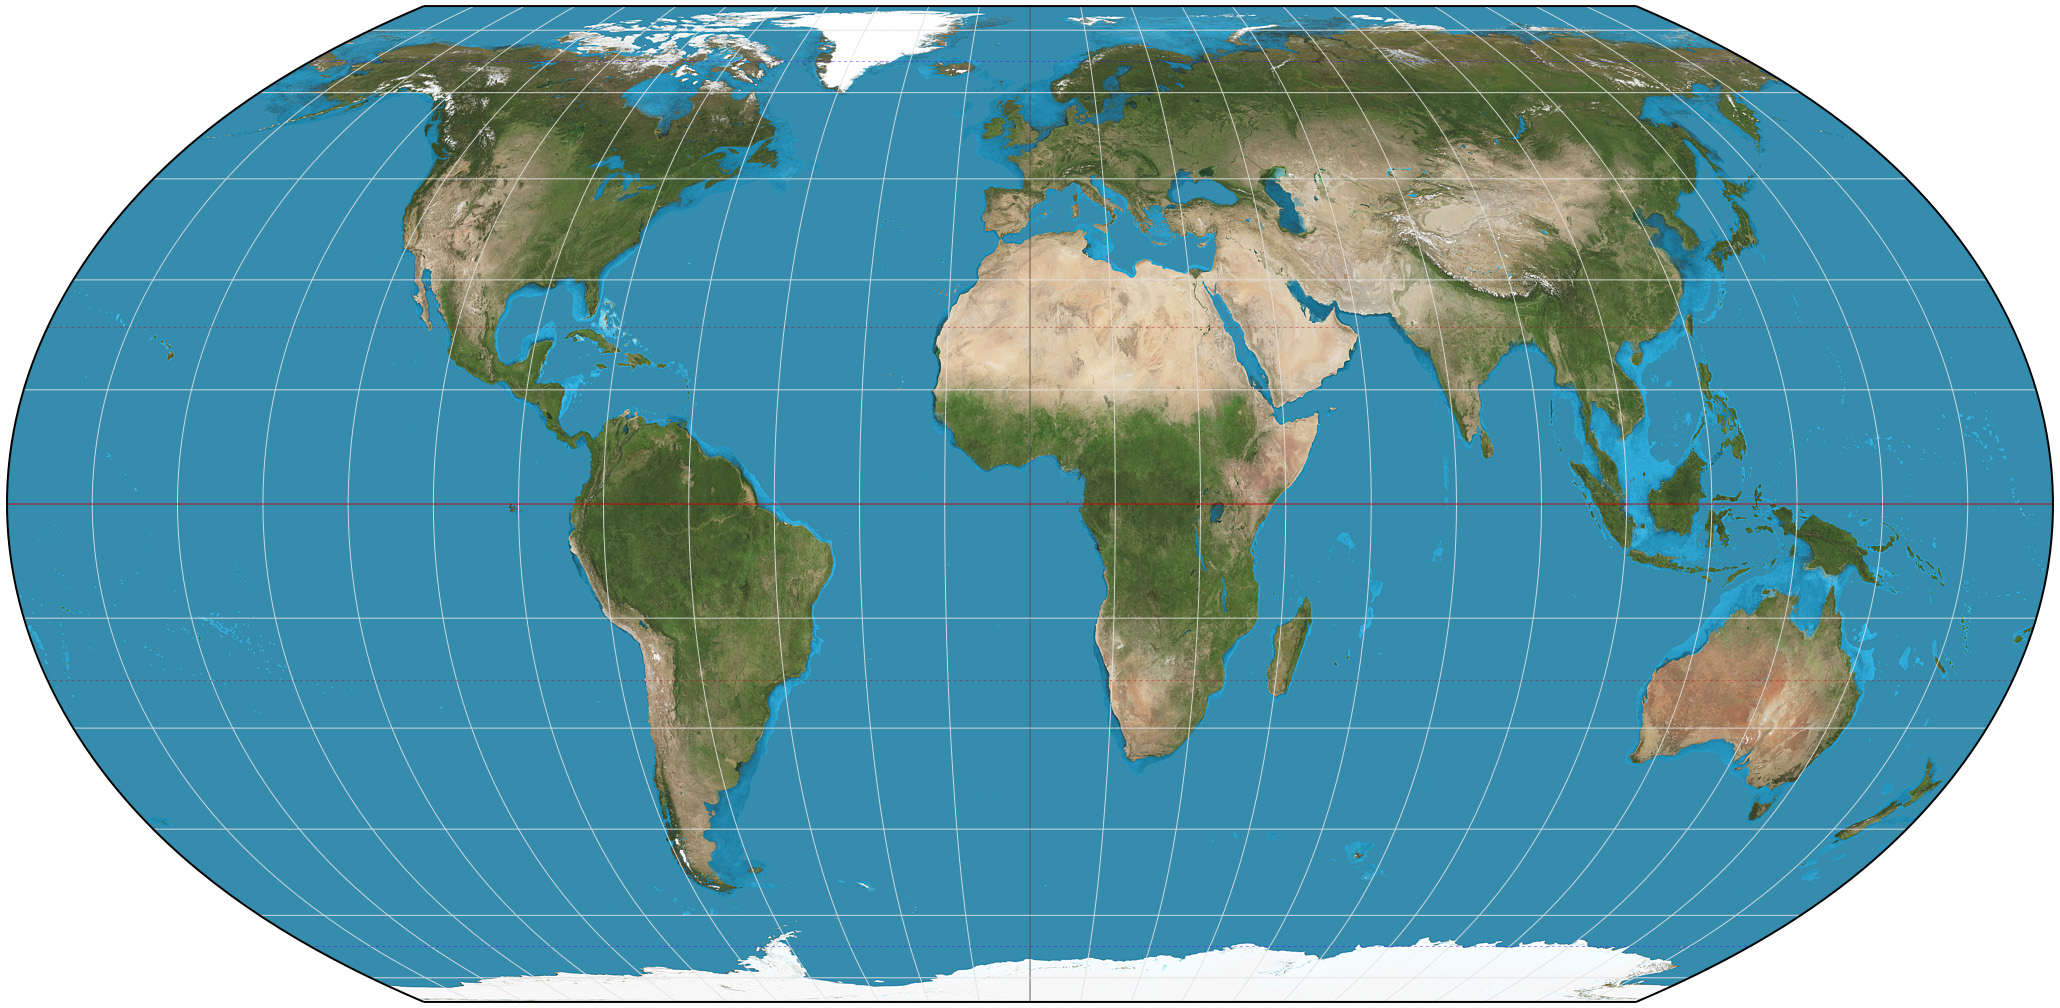
Compromise projections take a middle path. They do not preserve area perfectly or shape perfectly, but they try to keep several kinds of distortion reasonably balanced. Projections such as Robinson, Winkel Tripel, and Equal Earth became popular for general world maps because they avoid some of the most extreme visual problems. They are often better for broad geographic learning than a map designed mainly for navigation.
The key is to stop asking which world map is the correct one. A better question is: correct for what? If the goal is to compare country sizes, choose an equal-area map. If the goal is to follow local street directions on a phone, a web map may use a projection that supports smooth zooming and familiar angles. If the goal is to see Earth as a whole, a globe avoids many flat-map distortions altogether.
Routes, Distance, and Direction Can Shift Too
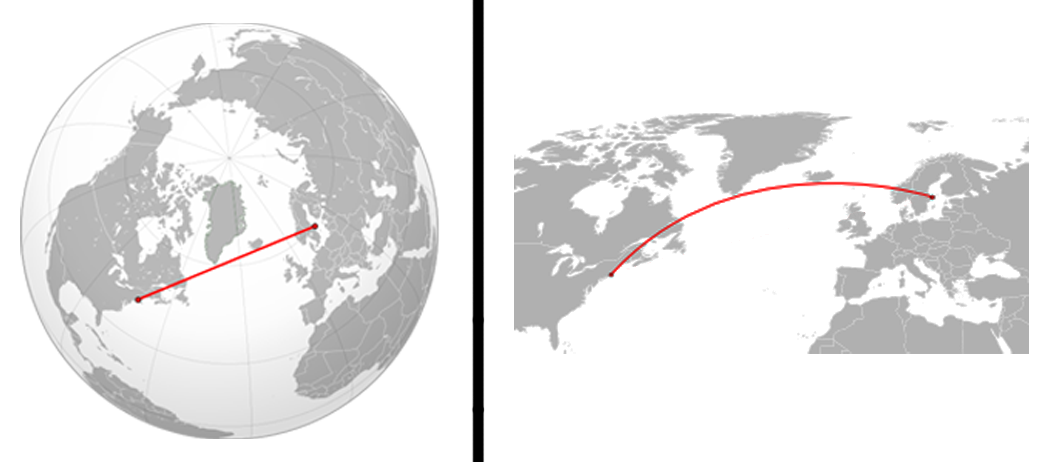
Map distortion is not only about country size. It also affects how routes look. The shortest path between two faraway cities on Earth is usually a great-circle route, the path you would get by slicing through the globe’s center and following the curve where that slice meets the surface. On many flat maps, that shortest route appears curved, even though it is the direct path on the sphere.
This can make air travel look surprising. A flight from North America to East Asia may arc northward across a flat map, making it seem as if the plane is taking a detour. On a globe, the route often makes more sense. The airplane is following Earth’s curvature, not the rectangle of a wall map.
Direction can be just as slippery. A projection may preserve angles locally while stretching area, or preserve area while bending shapes and directions. That is why professional map users care so much about projection choice. The wrong projection can make a route, distance, or pattern look more dramatic or less important than it really is.
How to Read a World Map More Carefully
The most useful habit is to look for the projection name. It is often printed near the edge of a map, in a legend, or in a source note. If the projection is named, it gives a clue about what the map is likely to show well and what it may distort. If the projection is not named, be cautious about making strong conclusions from shape, size, distance, or direction alone.
Next, ask what the map is trying to show. A map of earthquake zones, ocean currents, election results, shipping lanes, or language families may need a different projection from a map used to compare continent size. The colors, labels, and data may be the most visible parts, but the projection underneath still shapes the message.
It also helps to compare two maps or check a globe. Seeing the same world through more than one projection trains the eye to notice distortion instead of accepting the first image as reality. Students who compare Mercator, equal-area, and compromise maps often begin to see that maps are arguments as well as pictures. They organize space for a purpose.
Flat maps are not lies. They are carefully chosen compromises. The danger comes from forgetting the compromise and treating one familiar rectangle as the world itself. Once you know how projections work, a map becomes more useful, not less. It can still guide, explain, and reveal patterns, but it also invites a better question: what did this map preserve, and what did it have to bend?


Add comment