 Akshay Dinesh
A school assignment can look simple from the outside: type in an address, find the school, enroll. Underneath that simple result is a map. Streets, neighborhoods, apartment complexes, highways, rivers, rail lines, new housing developments, and school buildings all become part of a boundary system that decides where many students are expected to go.
These boundaries are usually called school attendance zones, attendance areas, or attendance boundaries. They are one of the clearest examples of human geography in everyday life because they turn place into access. Two students may live only a few blocks apart, yet a boundary line can send them to different elementary schools, different bus routes, and later different middle or high school feeder patterns. The line on the map may be invisible while walking down the street, but it can shape a family’s morning routine, a school’s enrollment, and the way a community understands its own neighborhoods.
What an Attendance Zone Actually Is
An attendance zone is a geographic area connected to a school. If a student lives inside that area and meets the district’s enrollment rules, that school is usually the assigned or “home” school. Some districts use attendance zones mainly for elementary schools, while others also use them for middle schools and high schools. In places with magnet schools, charter schools, open enrollment, or transfer programs, the assigned school may not be the only option, but it is still the default starting point.
The National Center for Education Statistics has treated these boundaries as important enough to map at a national scale. Its School Attendance Boundary Survey, developed through the EDGE program with help from the U.S. Census Bureau, collected attendance boundaries for more than 70,000 schools in over 12,000 districts for the 2013-2014 and 2015-2016 school years. That kind of dataset shows that school boundaries are not just local paperwork. They are spatial data, similar in some ways to voting precincts, ZIP Code areas, flood zones, or transit service areas.
Local districts often make the same idea visible through school locator tools. A family enters an address, and the tool identifies the assigned school or schools for that location. Chicago Public Schools, for example, describes neighborhood school boundaries as shaded areas on a map that can be viewed down to the street level. Austin ISD explains that its attendance areas determine which households are assigned to particular elementary, middle, and high schools, while still allowing transfers under district policy. The exact rules vary, but the geographic idea is the same: an address is matched to a mapped service area.
Why Districts Draw Boundaries in the First Place
The practical reason is capacity. A school building has only so many classrooms, teachers, cafeteria seats, parking spaces, buses, and minutes in the day. If one school becomes overcrowded while another has empty seats, a district may consider changing boundaries so enrollment is spread more evenly. New subdivisions, apartment construction, population shifts, school openings, school closures, and grade-level reorganizations can all force districts to revisit old lines.
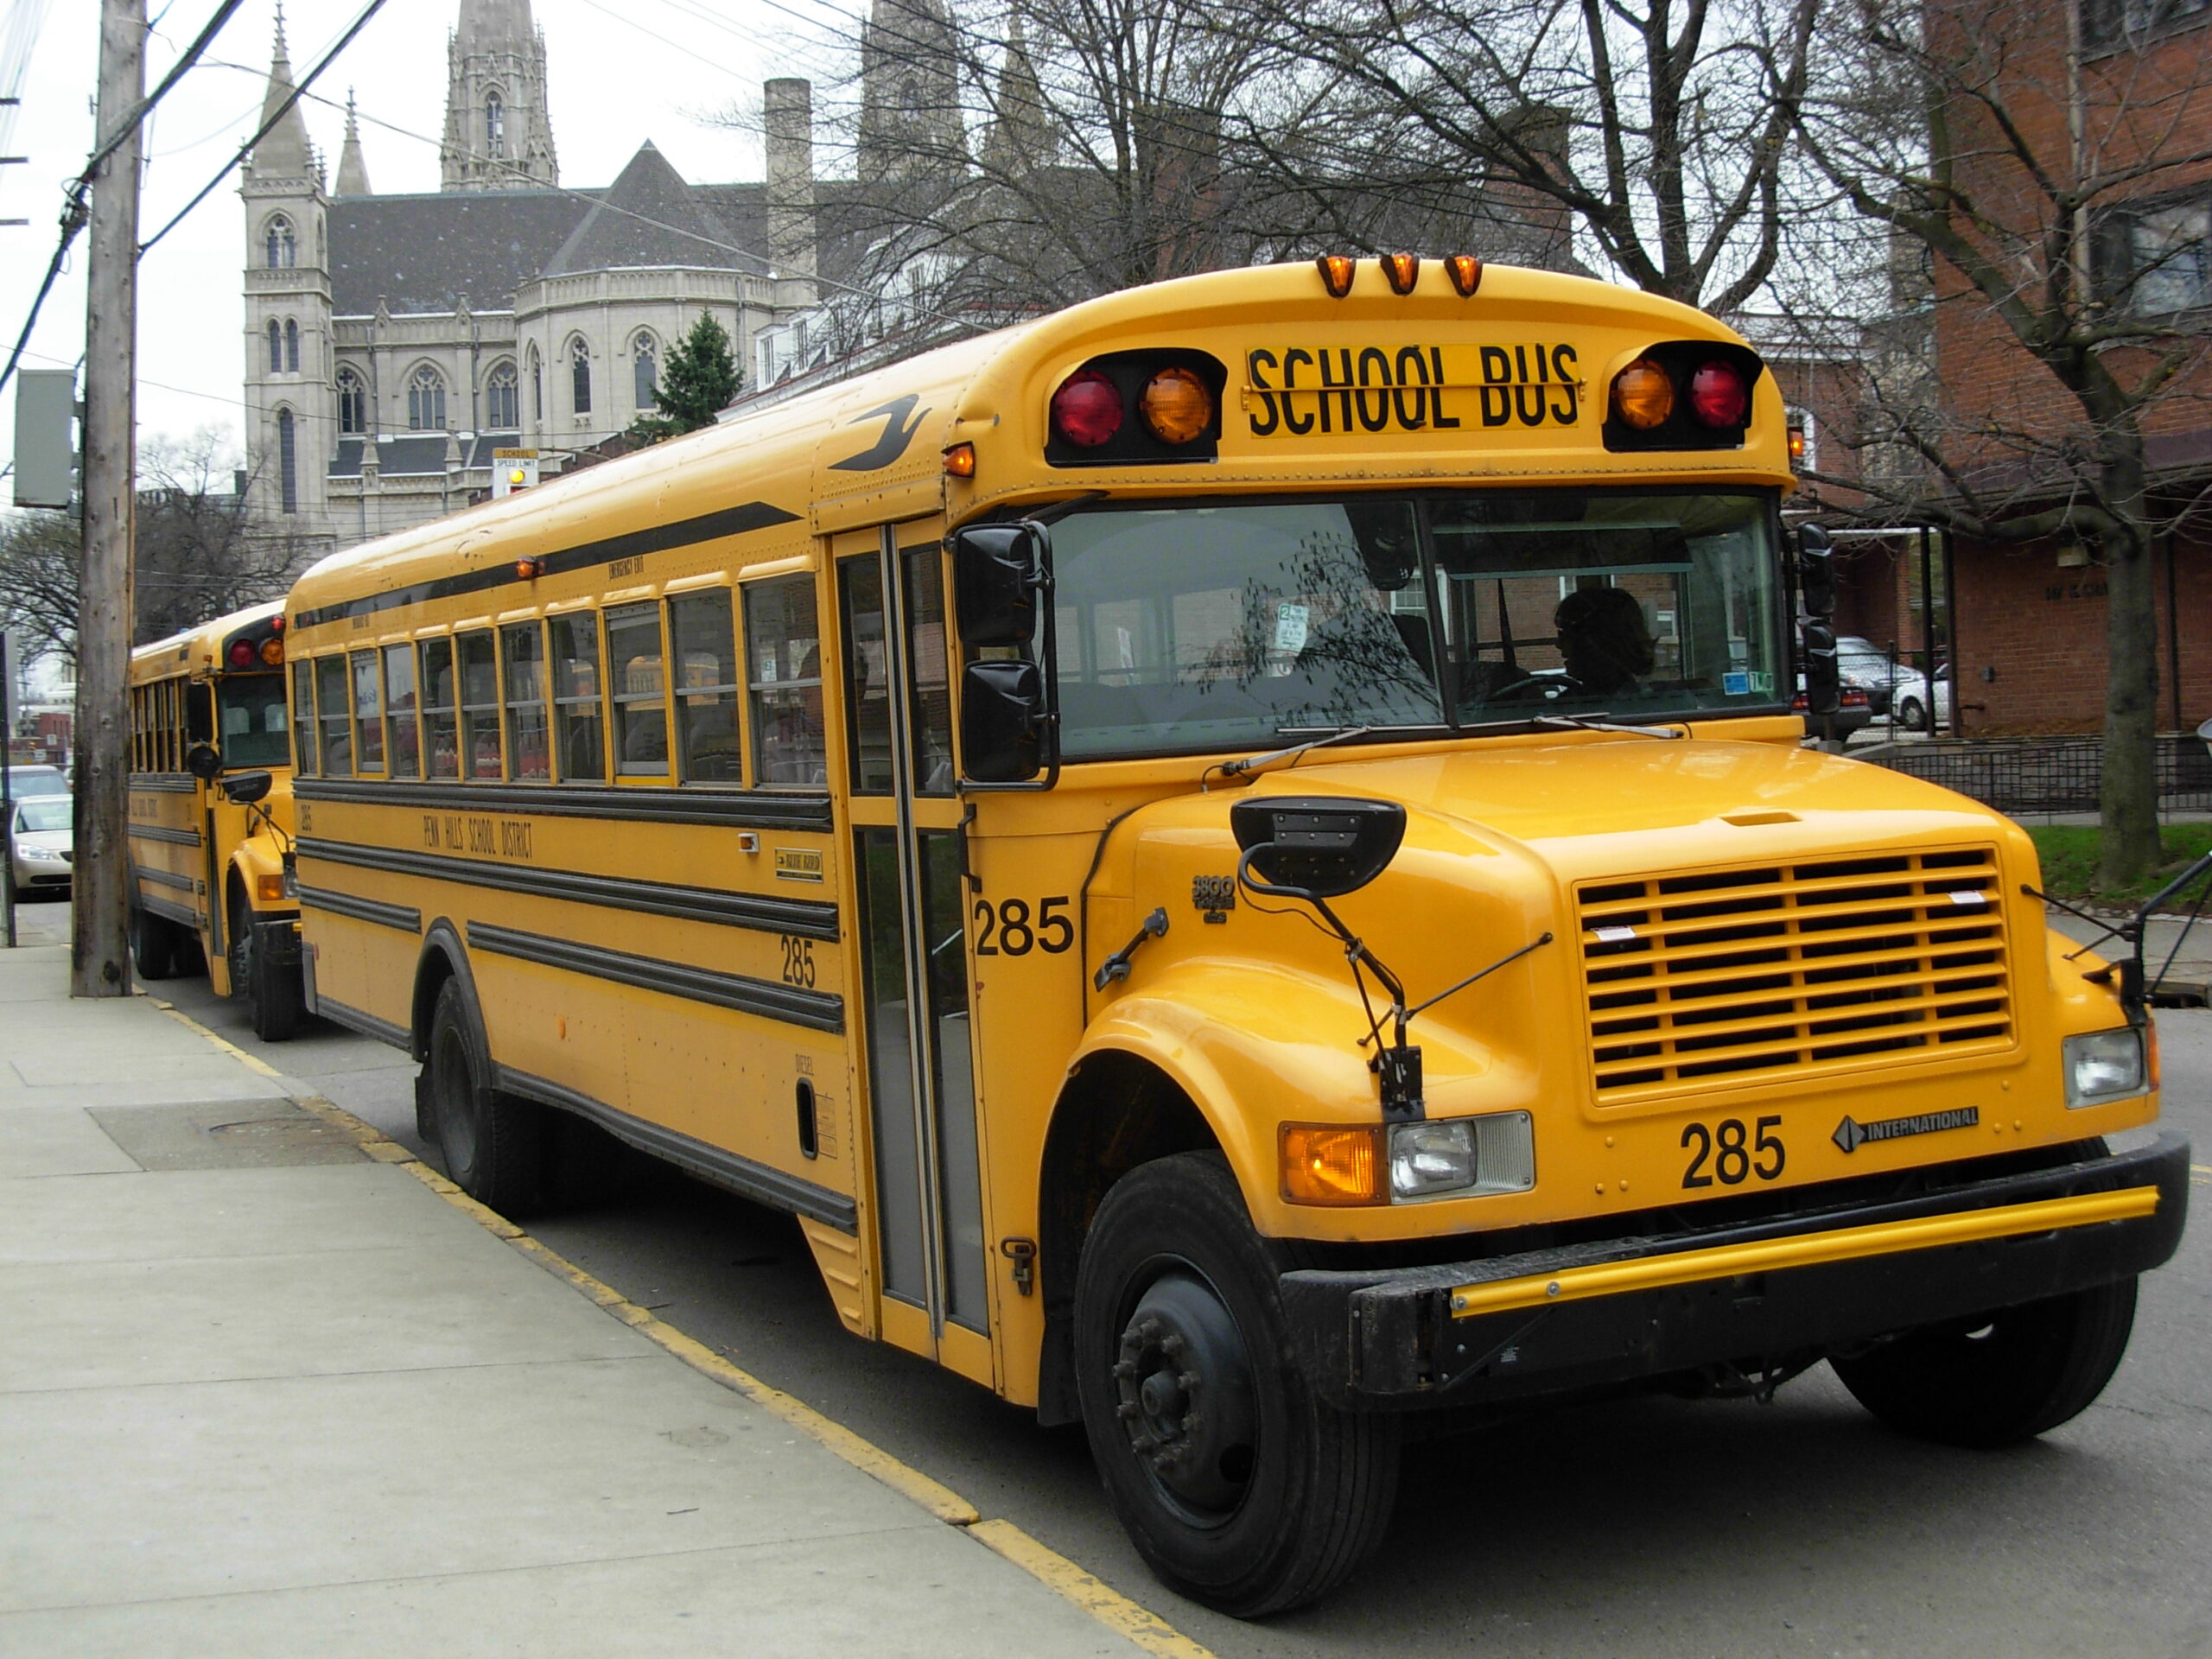
Transportation matters too. A boundary that looks neat on a map may create a difficult bus route if students have to cross major roads, travel around waterways, or ride a long distance past another school. District planners often think about travel time, walk zones, safe crossings, traffic patterns, and whether a bus can serve several neighborhoods efficiently. The map is not just about distance as the crow flies. It is about the routes students can actually take.
Boundaries also help districts plan services before the school year begins. If planners know which neighborhoods feed into each school, they can estimate enrollment, staffing, classroom needs, bus runs, special programs, and future building pressure. That is why attendance zones are often managed by planning, facilities, transportation, or geographic information system teams, not only by school principals. A boundary is both an enrollment rule and a planning tool.
How a Line on a Map Can Change Daily Life
The effects of an attendance zone can be very concrete. It may decide whether a student walks, rides a bus, gets dropped off by car, or crosses a busy road. It may determine whether siblings attend the same campus or split across different schools after a boundary change. It can affect after-school childcare, sports schedules, friendships, and how easily a parent can reach the school during the workday.
The same boundary can also change how families think about housing. Real estate listings often highlight assigned schools because many buyers and renters care about school access. That does not mean every family makes housing decisions around schools, or that a school’s reputation tells the full story of its quality. Still, the connection between address and assignment is powerful. A boundary can make one side of a street more desirable to some households simply because it feeds into a different school.
This is where geography becomes social, not just technical. Attendance zones often follow existing neighborhood patterns, and neighborhoods are shaped by housing costs, zoning rules, historic segregation, transportation access, and public investment. Research from groups such as the Urban Institute and Brookings has examined how school boundaries can reflect or reinforce racial and economic separation. The point is not that every boundary is drawn with unfair intent. It is that boundaries sit on top of unequal landscapes, so a line that looks neutral on a map can still produce unequal access.

Why Boundaries Change and Why Changes Feel Personal
School boundaries are not permanent, even when they feel settled. A district might redraw them when a new school opens, when one campus becomes overcrowded, when enrollment falls in another area, or when a neighborhood grows faster than expected. Boundary changes can also happen when districts revise feeder patterns, merge schools, expand specialized programs, or try to reduce long travel times.
These changes often become emotional because they touch daily routines and identity. Families may worry about longer commutes, losing a familiar school community, separating friends, or moving a younger sibling away from an older sibling’s path. Teachers and principals may worry about staffing, program continuity, and school culture. Board members and planners have to balance numbers on a map with the fact that every dot represents a real household.
That tension explains why public meetings about attendance zones can become intense. A planner may talk about building capacity and enrollment projections, while a parent talks about a child who finally feels comfortable at school. Both perspectives are real. A good boundary process has to make the data understandable, explain the tradeoffs clearly, and give people enough time to see how proposed changes would affect more than their own address.
How to Read a School Boundary Map Carefully
A school locator is useful, but it should not be read too casually. First, check the school year. Some districts publish current boundaries, future approved boundaries, and proposed boundaries at the same time. A map for 2026-2027 may not match the current year, and a proposal may not be final. Families should also check whether the map is for elementary, middle, or high school, because the same address can fall into different zones at different grade levels.
Second, look for program exceptions. A neighborhood assignment may not apply the same way to magnet programs, dual-language programs, special education placements, charter schools, transfer students, or open-enrollment options. A student may have a home school and still attend another school through an approved process. That is why many districts tell families to confirm assignment details with the enrollment office rather than relying only on a third-party map.
Third, zoom in when the address is close to a boundary. Street centerlines, parcel lines, apartment entrances, and new developments can matter. A house across the road may not always share the same assignment. In fast-growing areas, a newly built address may also take time to appear correctly in online tools. The safest habit is to use the official district locator, read the boundary notes, and confirm directly when the result affects enrollment, transportation, or a move.
The Bigger Lesson Hidden in the Map
School attendance zones show how geography quietly organizes public life. They connect homes to institutions, turn streets into service areas, and make planning decisions visible in the routines of students and families. A boundary can solve a capacity problem, shorten a bus route, protect a neighborhood school pattern, or create a new burden for families who already face long commutes and fewer choices.
That is why these maps deserve more attention than they usually get. They are not just technical drawings for administrators. They are public decisions about access, distance, belonging, and shared resources. Reading them well helps students and families understand why one school is assigned instead of another, and it helps communities ask better questions when the lines are redrawn.