Hurricane forecasts can look simple at first glance: a line on a map, a cone around it, a category number, and a list of places under watches or warnings. Behind those graphics is a fast-moving scientific process that turns ocean temperatures, satellite images, aircraft measurements, radar scans, and computer models into public guidance. The goal is not to predict every gust of wind perfectly days in advance. It is to show where danger is becoming more likely, how much uncertainty remains, and what hazards people should prepare for before conditions make preparation difficult.
The start of the 2026 Atlantic hurricane season makes that skill especially useful. NOAA’s National Weather Service outlook, released in May 2026, predicted a below-normal season overall, with 8 to 14 named storms, 3 to 6 hurricanes, and 1 to 3 major hurricanes. That outlook matters, but it does not mean any particular coastline is safe. Seasonal forecasts describe the broad climate background. A single storm, if it reaches land in the wrong place at the wrong time, can still become the storm people remember.
Seasonal Outlooks Set the Background, Not the Exact Story
A seasonal hurricane outlook is built from large-scale climate clues. Forecasters look at sea-surface temperatures, atmospheric pressure patterns, trade winds, moisture, and the state of El Niño or La Niña in the Pacific Ocean. These factors influence how easily tropical storms can form and strengthen across the Atlantic basin. Warm ocean water supplies energy, moist air helps thunderstorms grow, and weaker vertical wind shear allows a storm’s circulation to stay stacked instead of being torn apart.
El Niño is one reason NOAA expected the 2026 Atlantic season to be quieter than average. During many El Niño periods, stronger upper-level winds blow across parts of the tropical Atlantic. That creates vertical wind shear, meaning winds change speed or direction with height. A developing hurricane needs thunderstorms to rise around a stable center; strong shear can tilt that structure, push storms away from the center, and prevent a healthy circulation from organizing.
Still, seasonal outlooks are not landfall forecasts. NOAA explicitly separates overall basin activity from the question of where storms will strike. A season can produce fewer storms than usual and still have a damaging landfall. A busy season can also send many storms safely out to sea. The number of storms tells only part of the risk story, because risk depends on track, size, forward speed, rainfall, storm surge, local geography, and the preparedness of communities in the path.
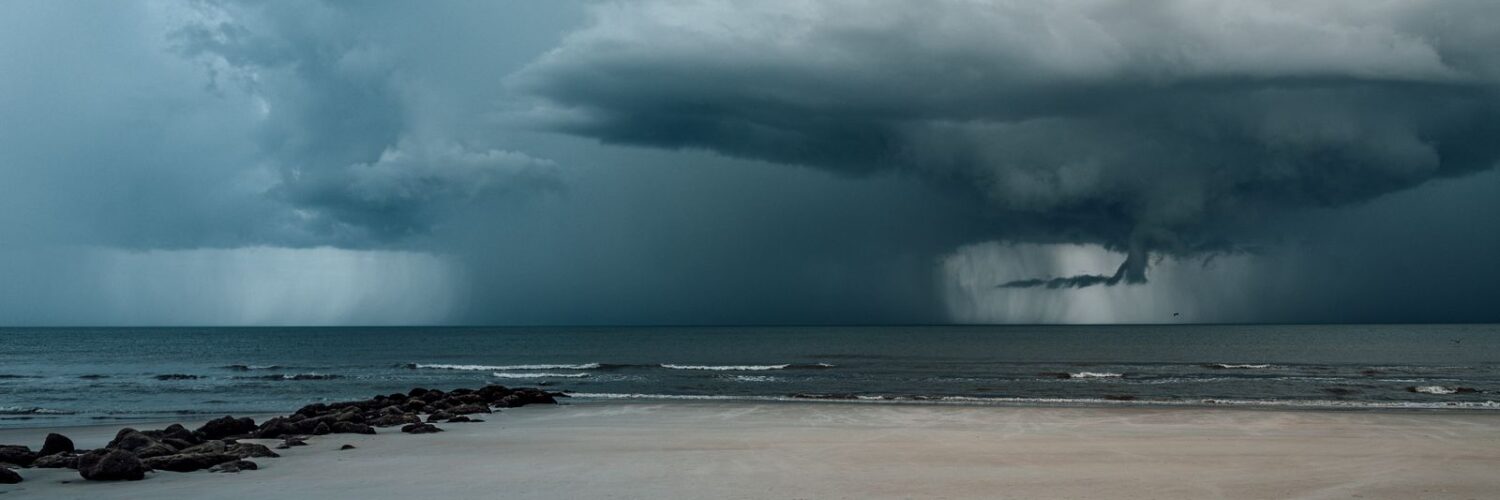
Forecasting Starts With Observing the Storm
Once a disturbance begins to organize, forecasters need observations from many angles. Satellites watch cloud patterns over the ocean, where there may be few weather stations. Infrared satellite imagery shows cloud-top temperatures, which can reveal deep thunderstorms. Visible imagery helps show whether bands are wrapping around a center. Microwave instruments can sometimes peer through upper cloud layers and reveal the storm’s inner structure more clearly.
Aircraft observations add a level of detail satellites cannot always provide. Hurricane Hunter aircraft can fly into or around tropical systems to measure pressure, wind, temperature, humidity, and the location of the center. Dropsondes, which are instrument packages released from aircraft, fall through the storm and send back vertical profiles of the atmosphere. These measurements help forecasters understand whether a system is strengthening, weakening, organizing, or struggling.
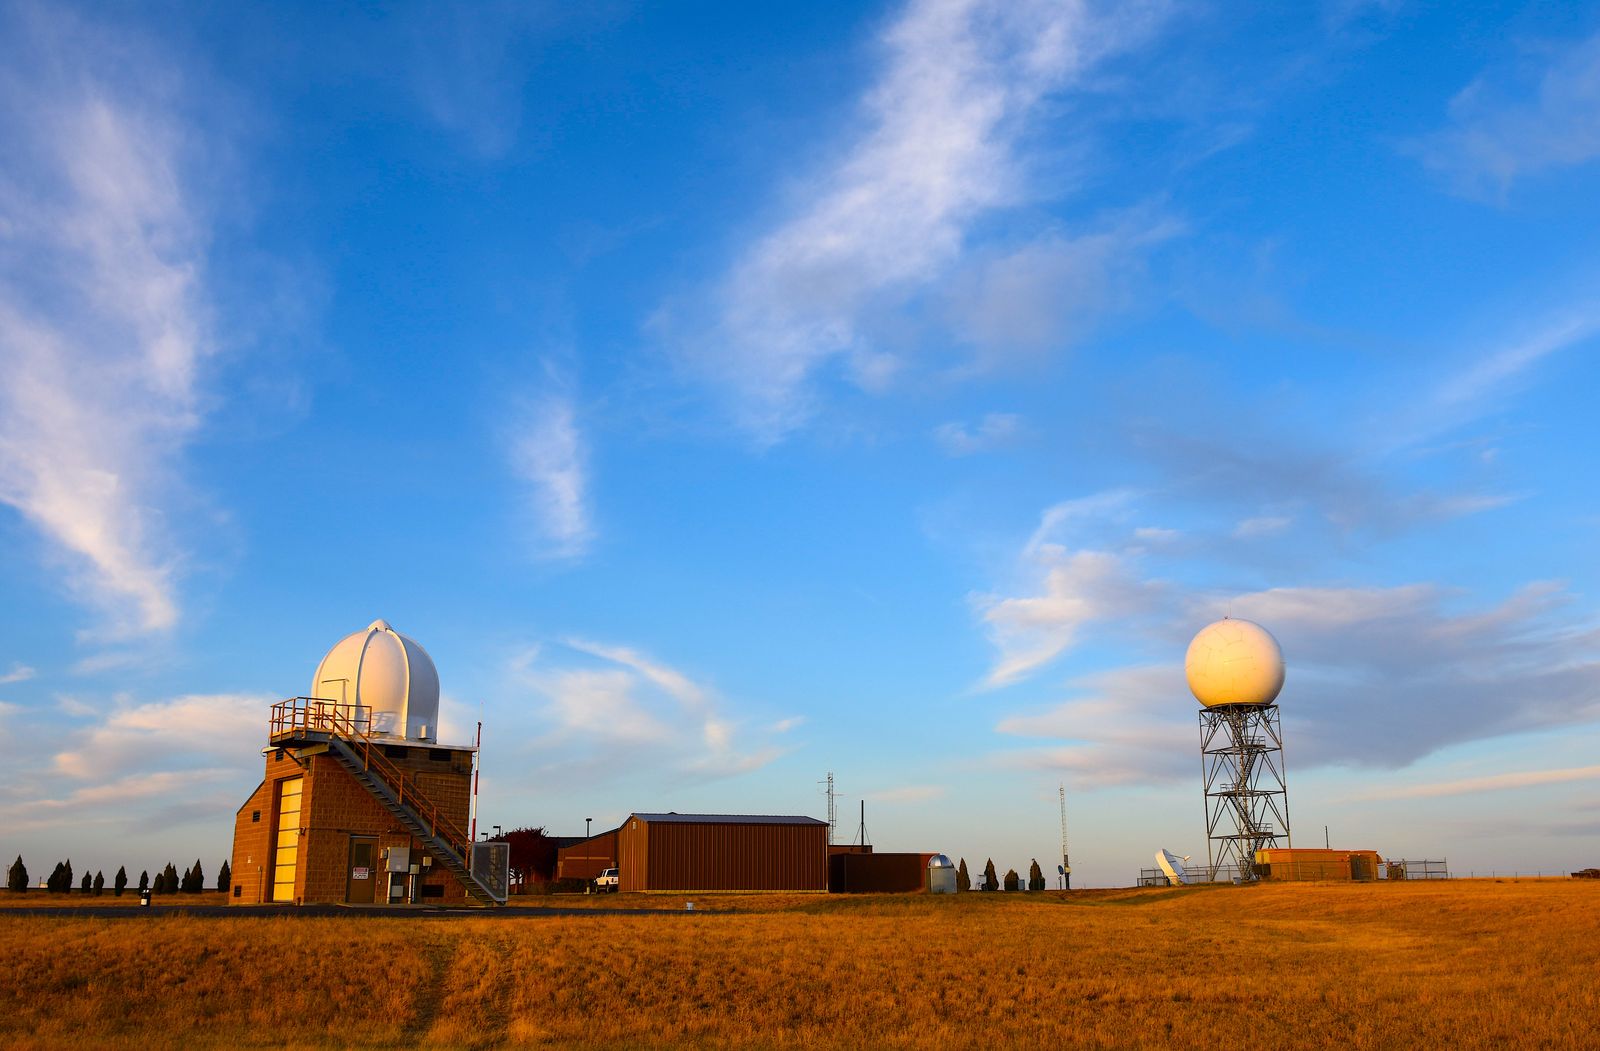
Near land, radar becomes especially important. Weather radar can show rain bands, eyewall structure, rotation, and where the heaviest rainfall is moving. Buoys, ships, coastal stations, and ocean instruments add more pieces. No single tool gives a complete picture. A forecast improves when many observations agree, and forecasters become more cautious when the data point in different directions.
Computer Models Offer Possibilities, Not Certainty
Computer models are often discussed as if one model should simply “win.” In reality, models are tools for exploring how the atmosphere may evolve. They start with an estimate of current conditions, apply equations that describe motion, heat, moisture, and pressure, and project possible futures. Because the atmosphere is enormous and never measured perfectly, small differences in the starting picture can grow into meaningful differences several days later.
That is why forecasters study model ensembles. An ensemble runs a model many times with slightly different starting conditions or methods. If many runs cluster along a similar path, confidence in the general track may rise. If the runs spread widely, the forecast becomes less certain. The same idea applies to intensity, though intensity is often harder to predict than track because it depends on smaller-scale processes inside the storm.
Intensity forecasting has improved, but it remains challenging. A hurricane can strengthen quickly if it passes over very warm water, moves through moist air, avoids strong shear, and develops a well-organized inner core. It can weaken if dry air enters, shear increases, land disrupts the circulation, or the storm churns up cooler water beneath itself. Rapid intensification is especially difficult because it can happen over a short period, sometimes close to land.
The Forecast Cone Is About the Center, Not the Whole Hazard
The forecast cone is one of the most recognized hurricane graphics, but it is also one of the easiest to misunderstand. The cone does not show the full size of the storm. It does not mean areas outside the cone are safe. It shows the likely range of the storm center’s track based on past forecast errors. A large hurricane can send dangerous winds, rain, storm surge, tornadoes, and rough surf far from its center.
The National Hurricane Center has tried to make that message clearer. For the 2026 hurricane season, the operational cone graphic includes tropical storm and hurricane watches and warnings for inland areas, not only coastal areas. That change matters because wind hazards do not stop at the beach. Storms can keep producing damaging winds and heavy rain well inland, especially if they are large, fast-moving, or interacting with other weather systems.
The National Hurricane Center also began testing an experimental cone in 2026 that uses ellipses at forecast points and represents a broader range of track possibilities than the traditional cone. The reason is practical: uncertainty is not always shaped like a neat circle around each point. Sometimes the bigger question is whether a storm will move faster or slower. Sometimes the main uncertainty is whether it will bend north or continue west. A better graphic can help people see uncertainty as a real part of the forecast, not as a mistake.
Hazards Matter More Than the Category Number
The Saffir-Simpson category scale describes wind speed, but wind is only one hurricane danger. A Category 1 hurricane can produce deadly flooding. A storm that weakens before landfall can still push water into bays, rivers, and low-lying neighborhoods. A slow tropical storm can drop extraordinary rain even if its winds never become extreme. The category number is useful, but it should never be the only thing people watch.

Storm surge is often the most dangerous coastal hazard. It happens when hurricane winds push ocean water toward land, raising water levels above the normal tide. The shape of the coastline, the slope of the seafloor, the storm’s angle of approach, and the timing of tides can all influence how high the water rises. That is why two storms with similar wind speeds can produce very different surge impacts.
Rainfall is another separate forecast problem. A storm’s forward speed, moisture supply, and interaction with fronts or mountains can shape how much rain falls. Inland flooding can occur far from where the center crosses the coast. The National Weather Service warning system reflects this by separating wind, storm surge, rainfall flooding, tornado, and coastal hazard information. A careful reader asks not only “Where is the center going?” but also “Which hazards are expected where I am?”
How to Read a Hurricane Forecast Wisely
A good forecast reader pays attention to layers. The tropical weather outlook shows whether a disturbance may develop over the next several days. Watches and warnings show where hazardous conditions are possible or expected within a shorter window. Key messages explain the main hazards in plain language. Local National Weather Service offices translate the larger storm forecast into local impacts, including rainfall amounts, timing, wind expectations, and flooding concerns.
Timing matters because preparations become harder once winds rise. The National Weather Service notes that hurricane watches are generally issued when hurricane conditions are possible and tropical-storm-force winds may arrive within about 48 hours. Hurricane warnings are generally issued when hurricane conditions are expected and preparations should be completed before tropical-storm-force winds begin. Those lead times are designed around human decisions, not just meteorology.
The best habit is to treat each update as a clearer snapshot, not a final answer. Forecasts usually become more precise as a storm gets closer, but hazards may also escalate quickly. A shift of 30 or 50 miles can change who receives the worst surge. A slower track can raise rainfall totals. A stronger inner core can make wind damage more serious. Checking official updates regularly is not overreacting; it is how uncertainty is managed.
Hurricane forecasting has become more skillful because scientists observe storms more closely, models have improved, and public warning systems keep evolving. Yet the basic lesson remains humble: forecasts are guidance under uncertainty. They are strongest when people read them as a set of risks rather than a single line on a map. A quieter seasonal outlook may reduce the odds of many storms, but preparedness still depends on noticing the storm that actually forms, understanding the hazards it brings, and acting before the weather closes in.


Add comment