Akshay Dinesh
When a heat wave, flood, wildfire, or hurricane breaks a record, a familiar question follows: Did climate change cause it? Climate science rarely gives that question a simple yes or no. Weather disasters emerge from several forces acting together, including natural variability, local geography, the timing of atmospheric patterns, and human decisions about where and how people build. A warmer climate can still load the odds or intensify part of the event, even when it is not the only cause.
Extreme event attribution is the field that measures that influence. Instead of trying to assign a single cause, researchers ask how human-caused warming changed the probability or severity of a clearly defined event. The World Climate Research Programme placed this work alongside monitoring, long-term trends, physical mechanisms, and regional case studies in its first Annual Assessment of Weather and Climate Extremes, released in October 2026. A separate 2026 review by the National Academies of Sciences, Engineering, and Medicine found that attribution methods have advanced considerably, while also warning that confidence still depends strongly on the type of weather being studied.
A better question than “Did climate change cause it?”
A particular storm is a physical chain of events, not a coin with one label on each side. Warm ocean water may supply energy, a pressure pattern may steer moisture toward a coast, saturated ground may worsen flooding, and development in a floodplain may increase the damage. Human-caused climate change can alter one or more of those ingredients without creating the entire chain by itself. That is why researchers usually ask, “How much did climate change change the odds or intensity of an event like this one?”
The phrase an event like this one matters. Before running models, scientists must define the event precisely: the region, dates, duration, and measurement that made it extreme. A heat study might examine the highest three-day average temperature across a specified area. A rainfall study might focus on the wettest five-day total in a river basin. Change the boundary or the measurement, and the result may change because the study is answering a different question.
This framing also separates weather from impact. The same amount of rain can produce modest disruption in one place and catastrophe in another, depending on drainage, building standards, land cover, warnings, and who is exposed. The newer field of extreme event impact attribution tries to estimate how climate change affected outcomes such as deaths, illness, crop losses, or economic damage. The National Academies describes that work as promising but less mature than attribution of the weather itself.
The two worlds scientists compare
Researchers begin with observations from weather stations, rain gauges, ocean buoys, radar, and satellites. They use these records to estimate how unusual the event was in the present climate and whether similar events have changed over time. An event described as “one in 100 years” does not arrive on a fixed schedule. It means that an event at least that severe has about a 1 percent chance in any given year under the climate conditions used for the calculation.
The next step is a controlled comparison that cannot be performed on the real planet. Scientists run many climate simulations representing the world as it exists, including the warming influence of human greenhouse gas emissions. They compare those simulations with a counterfactual world in which that human influence is removed or greatly reduced. Large ensembles create hundreds or thousands of plausible weather histories, giving researchers enough examples to compare rare events statistically.
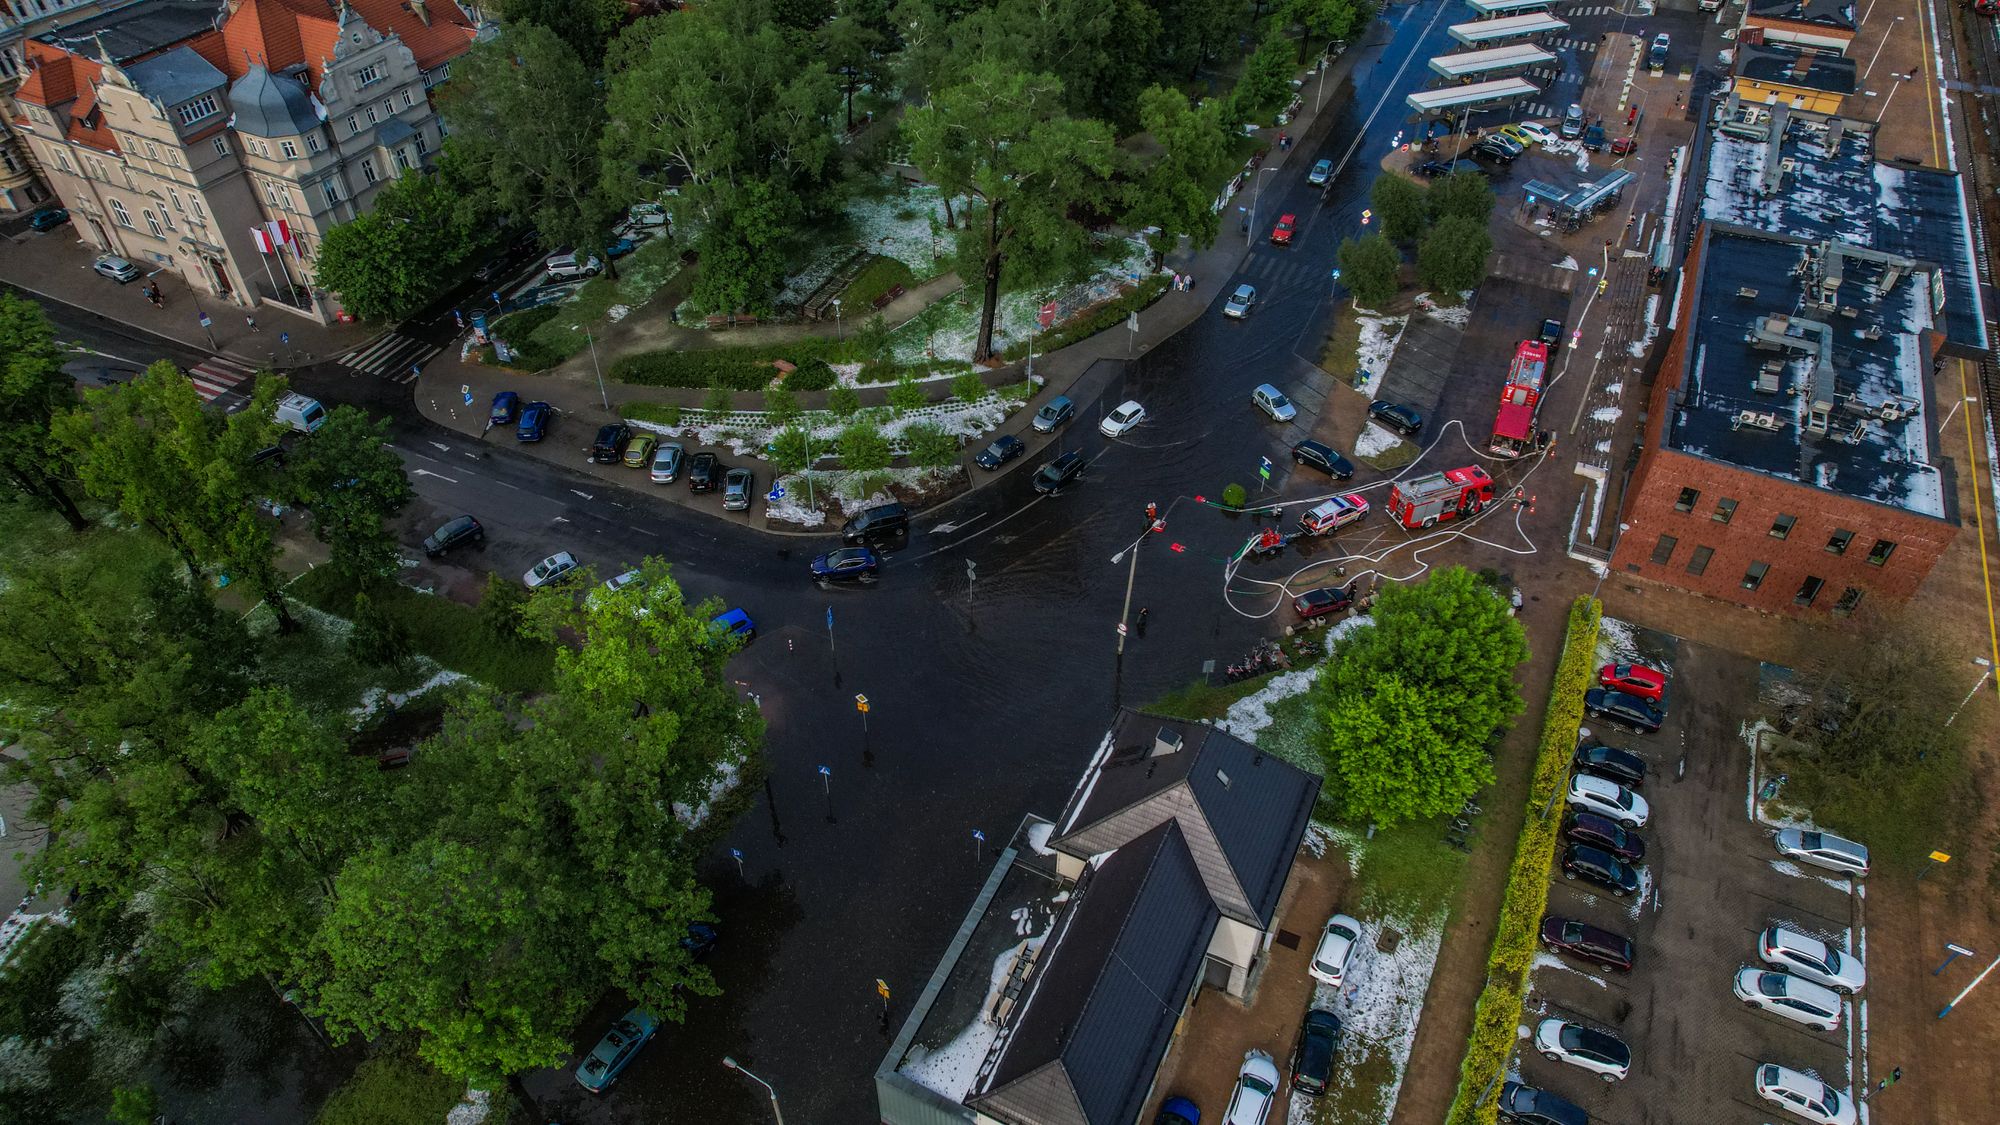
Suppose an extreme rainfall total has a 1 percent annual chance in the cooler counterfactual world and a 3 percent chance in the present climate. The risk ratio is three, so the study could report that warming made that kind of event about three times as likely. Researchers can reverse the comparison and hold probability constant: perhaps an event with the same rarity now delivers 8 percent more rain. Real studies report uncertainty ranges around such estimates, since observations, models, and the event definition all have limits.
No single model gets the final word. Strong studies compare several observational datasets and multiple models, discard models that cannot represent the relevant regional climate, and then combine the remaining evidence. World Weather Attribution calls this final step a synthesis. Agreement among observations, models, and well-understood physics raises confidence; wide disagreement produces a broad uncertainty range or may prevent a quantitative conclusion.
Why heat is easier to attribute than tornadoes
Attribution is strongest when three pieces line up: a reliable observational record, models that reproduce the event type, and a clear physical explanation for how warming affects it. Extreme heat performs well on all three. Temperature records are relatively long and consistent, climate models simulate large-scale heat effectively, and the connection between a warmer background climate and higher temperature extremes is direct. The 2026 National Academies review found the highest confidence for extreme heat and cold, along with large-scale heavy rainfall and other events strongly influenced by a warming atmosphere.
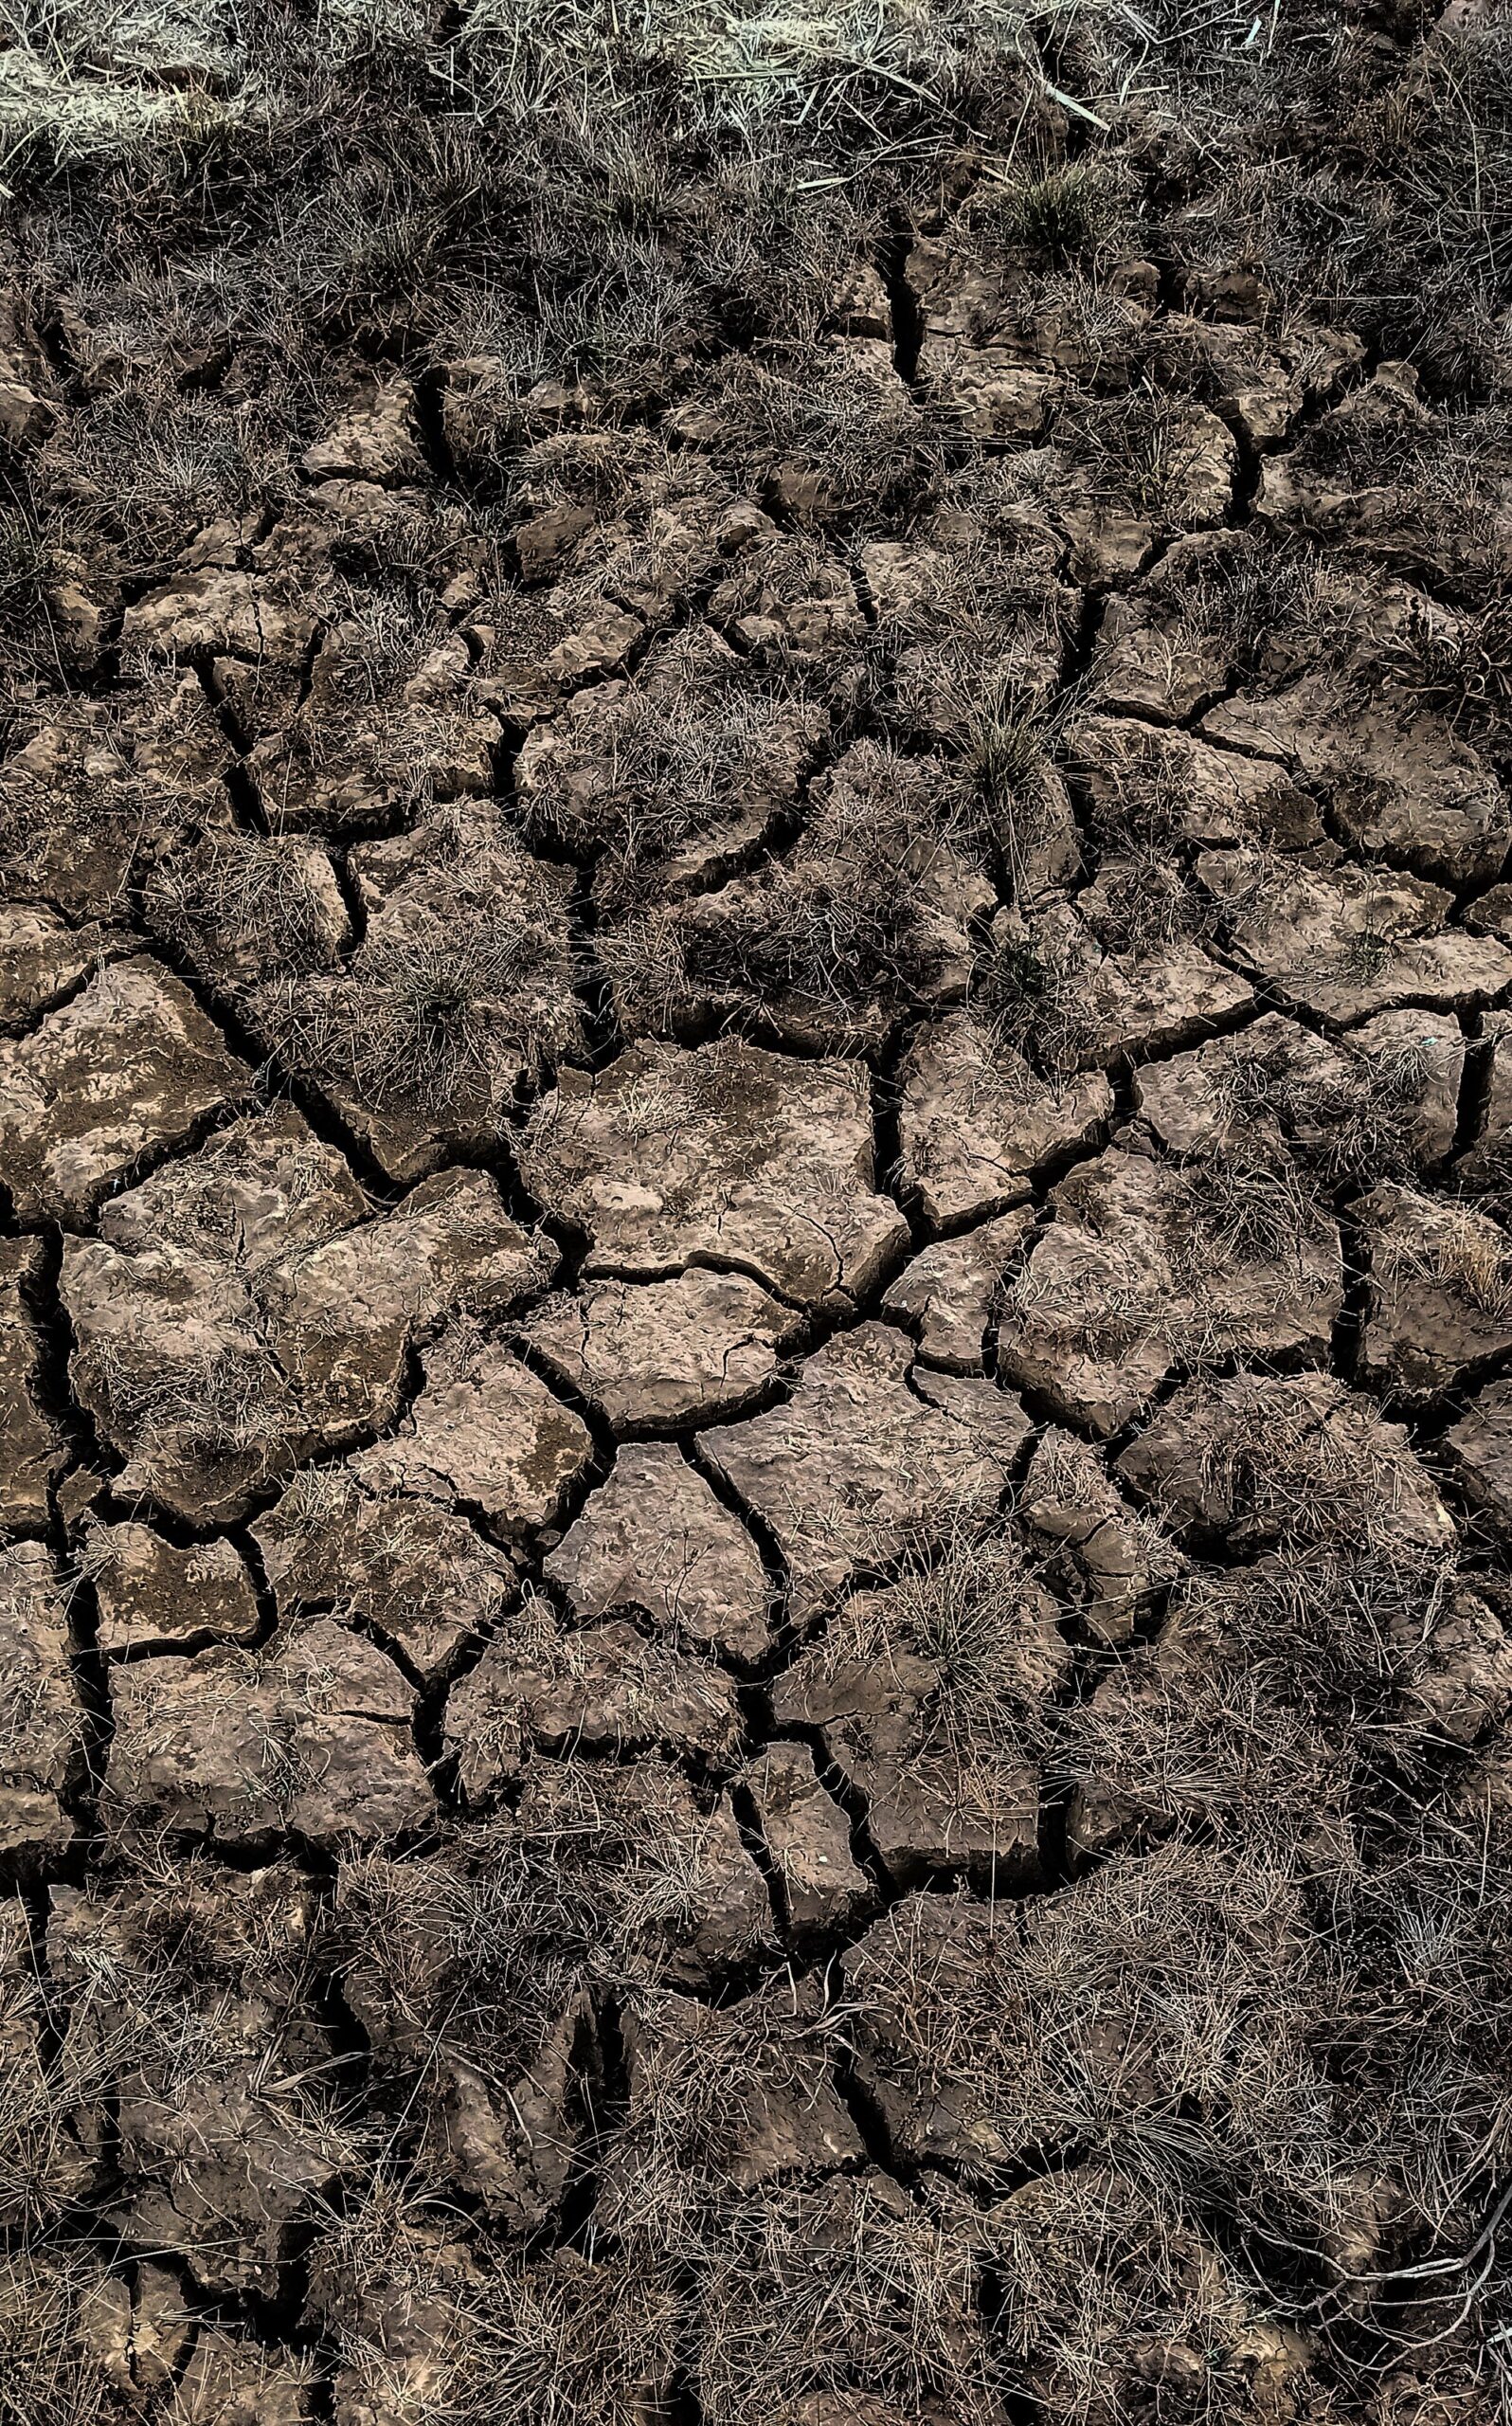
Heavy rainfall has a firm physical starting point because warmer air can hold more water vapor, but local outcomes still depend on storm motion, terrain, and circulation. Drought is more complicated because it can be defined by rainfall, soil moisture, streamflow, crop stress, or some combination of them. Wildfire is harder still: heat and dryness influence fire weather, while ignition, vegetation, fuel management, wind, and firefighting shape what actually burns. A study may confidently attribute an increase in fire-prone conditions without claiming that climate change alone caused a particular fire.
Tornadoes and severe thunderstorms remain among the most difficult cases. Their key processes unfold on scales too small for many global climate models to resolve directly, and changes in observing practices make the historical record uneven. Tropical cyclones also contain several questions at once: formation, wind speed, rainfall, storm surge, and rapid intensification may each respond differently. A headline that treats all parts of a hurricane as one signal can hide more than it explains.
Geography creates another unevenness. Regions with long, dense observing networks support stronger estimates than places with sparse stations or gaps in records. The National Academies warned that limited data and model constraints lower attribution capacity in many under-resourced and highly vulnerable regions. That is not evidence that climate change has no influence there. It is a measurement gap, and confusing missing evidence with evidence of no effect would deepen the inequity.
How to read an attribution result without overreading it
Look first for the exact event definition. “Climate change made the flood more likely” is incomplete unless the study says which rainfall measure, location, and time span it analyzed. Next, check whether the result concerns likelihood, intensity, or both. Warming can make an event more common without clearly increasing its peak strength, or increase its intensity without producing a precise probability estimate.
Pay attention to the uncertainty interval rather than only the central number. A best estimate that an event became four times as likely may come with a range from twice as likely to ten times as likely. That range still supports increased risk, but it shows that the size of the increase is less certain than a single number suggests. If the interval includes no change, the evidence may be inconclusive rather than proof of no influence.
Timing and review also matter. Rapid attribution teams can release an analysis within days or weeks, using a method tested in peer-reviewed research. Speed is valuable when communities are making immediate decisions, but a rapid analysis is not identical to a journal paper that has completed external review. The National Academies recommends common best practices, studies that apply multiple approaches to the same event, and periodic peer review for operational attribution programs.
Apparent contradictions often come from different questions. One team may study a storm’s rainfall while another examines its winds; one may use a city boundary while another studies an entire river basin. Both results can be sound even if one finds a strong climate influence and the other does not. The responsible comparison is between event definitions, datasets, models, and uncertainty, not just the shortest sentence in each news report.
Why changing the odds changes real decisions
Attribution turns a broad global trend into information about risk at a particular place and scale. If an event once described as a 100-year flood is now several times more likely, a map or drainage system based on the old odds may underestimate present danger. Insurers, engineers, emergency managers, farmers, and public-health officials need estimates that reflect the climate in which infrastructure and communities will actually operate. The point is not to relabel a past disaster; it is to avoid preparing for a past that no longer describes the future.
The same evidence can reveal where caution is necessary. A confident heat attribution and an uncertain tornado attribution do not represent a contradiction in climate science. They show that different hazards leave different fingerprints and that scientific confidence should match the available data and physical understanding. Honest limits make attribution more useful because they keep a probability statement from turning into a claim the research did not test.
The most accurate answer after an extreme event may therefore be neither “climate change caused it” nor “weather has always varied.” A better answer identifies the event carefully, compares its odds and intensity across possible climates, and states the uncertainty plainly. That approach is less dramatic than a verdict, but it is far more useful. It tells communities how the risk has shifted and what kind of evidence should guide the next decision.