Akshay Dinesh
A price can rise long before a shopper sees it on a shelf. A refinery charges more for fuel, a trucking company raises its freight rate, or a manufacturer receives more for a machine. These transactions happen at different points in the economy, and the Producer Price Index is designed to track them.
The September 2026 release made that measure unusually visible. The U.S. Bureau of Labor Statistics reported that its index for final demand rose 1.3 percent in one month and 6.3 percent over the year, the largest increases since 2022. Energy accounted for much of the monthly jump, which is exactly why a dramatic headline is only the beginning of a useful reading. The PPI can show where price pressure is building, but it is not a forecast of a household’s next grocery bill.
What the Producer Price Index measures
The PPI measures average changes in the selling prices received by domestic producers for their output. The phrase prices received is the key. The index is not a survey of what a factory spends on wages, electricity, or raw materials, although those costs may influence the price it charges. It follows the revenue side of transactions: what producers receive when they sell goods, services, and construction.
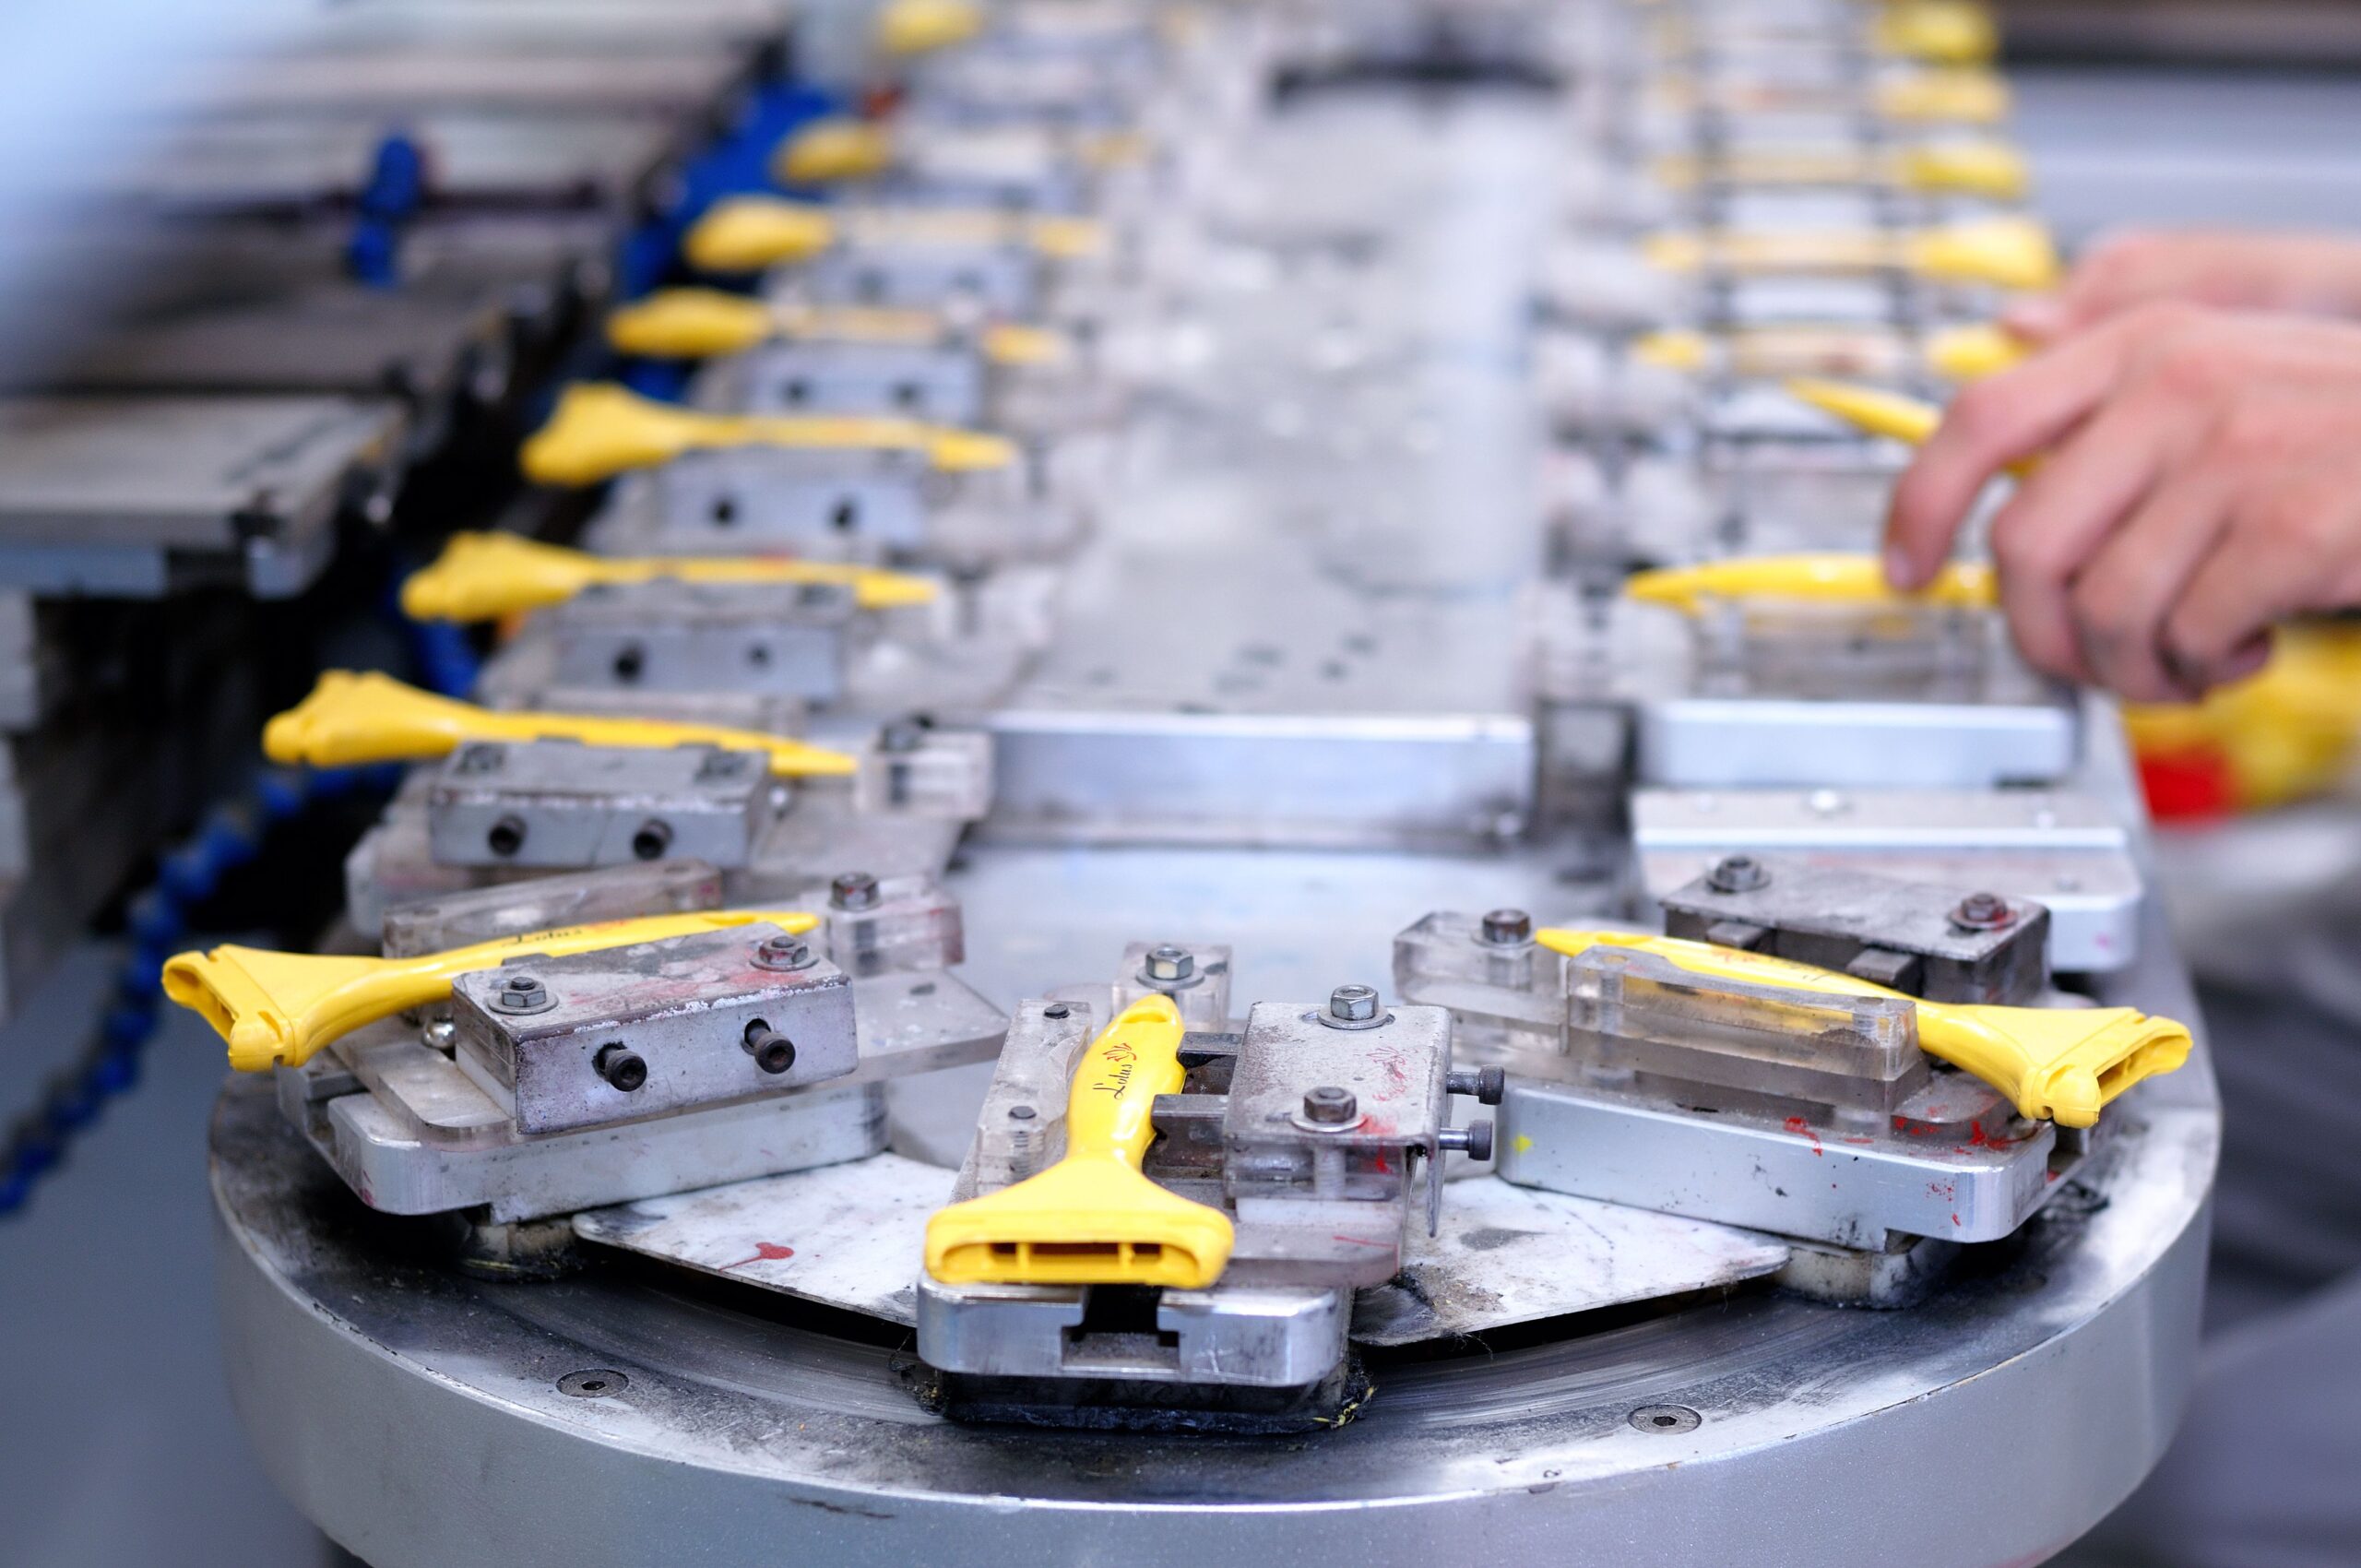
BLS builds the index from a probability-based sample of producing establishments. Participating businesses usually report prices each month for carefully selected transactions, including details such as the product, customer, order size, and contract terms. Analysts review unusually large movements and adjust for meaningful changes in quality so that the index compares like with like as closely as possible. The program processes prices for about 50,000 items each month, then combines them with weights that reflect their economic importance.
The modern PPI is far broader than the old image of a wholesale-goods index. Its final demand measure covers domestic output sold for personal consumption, business investment, government purchases, and export. It includes goods, services, and construction. For wholesalers and retailers, BLS generally measures the margin between the acquisition price and resale price because the service being produced is distribution, not the merchandise itself.
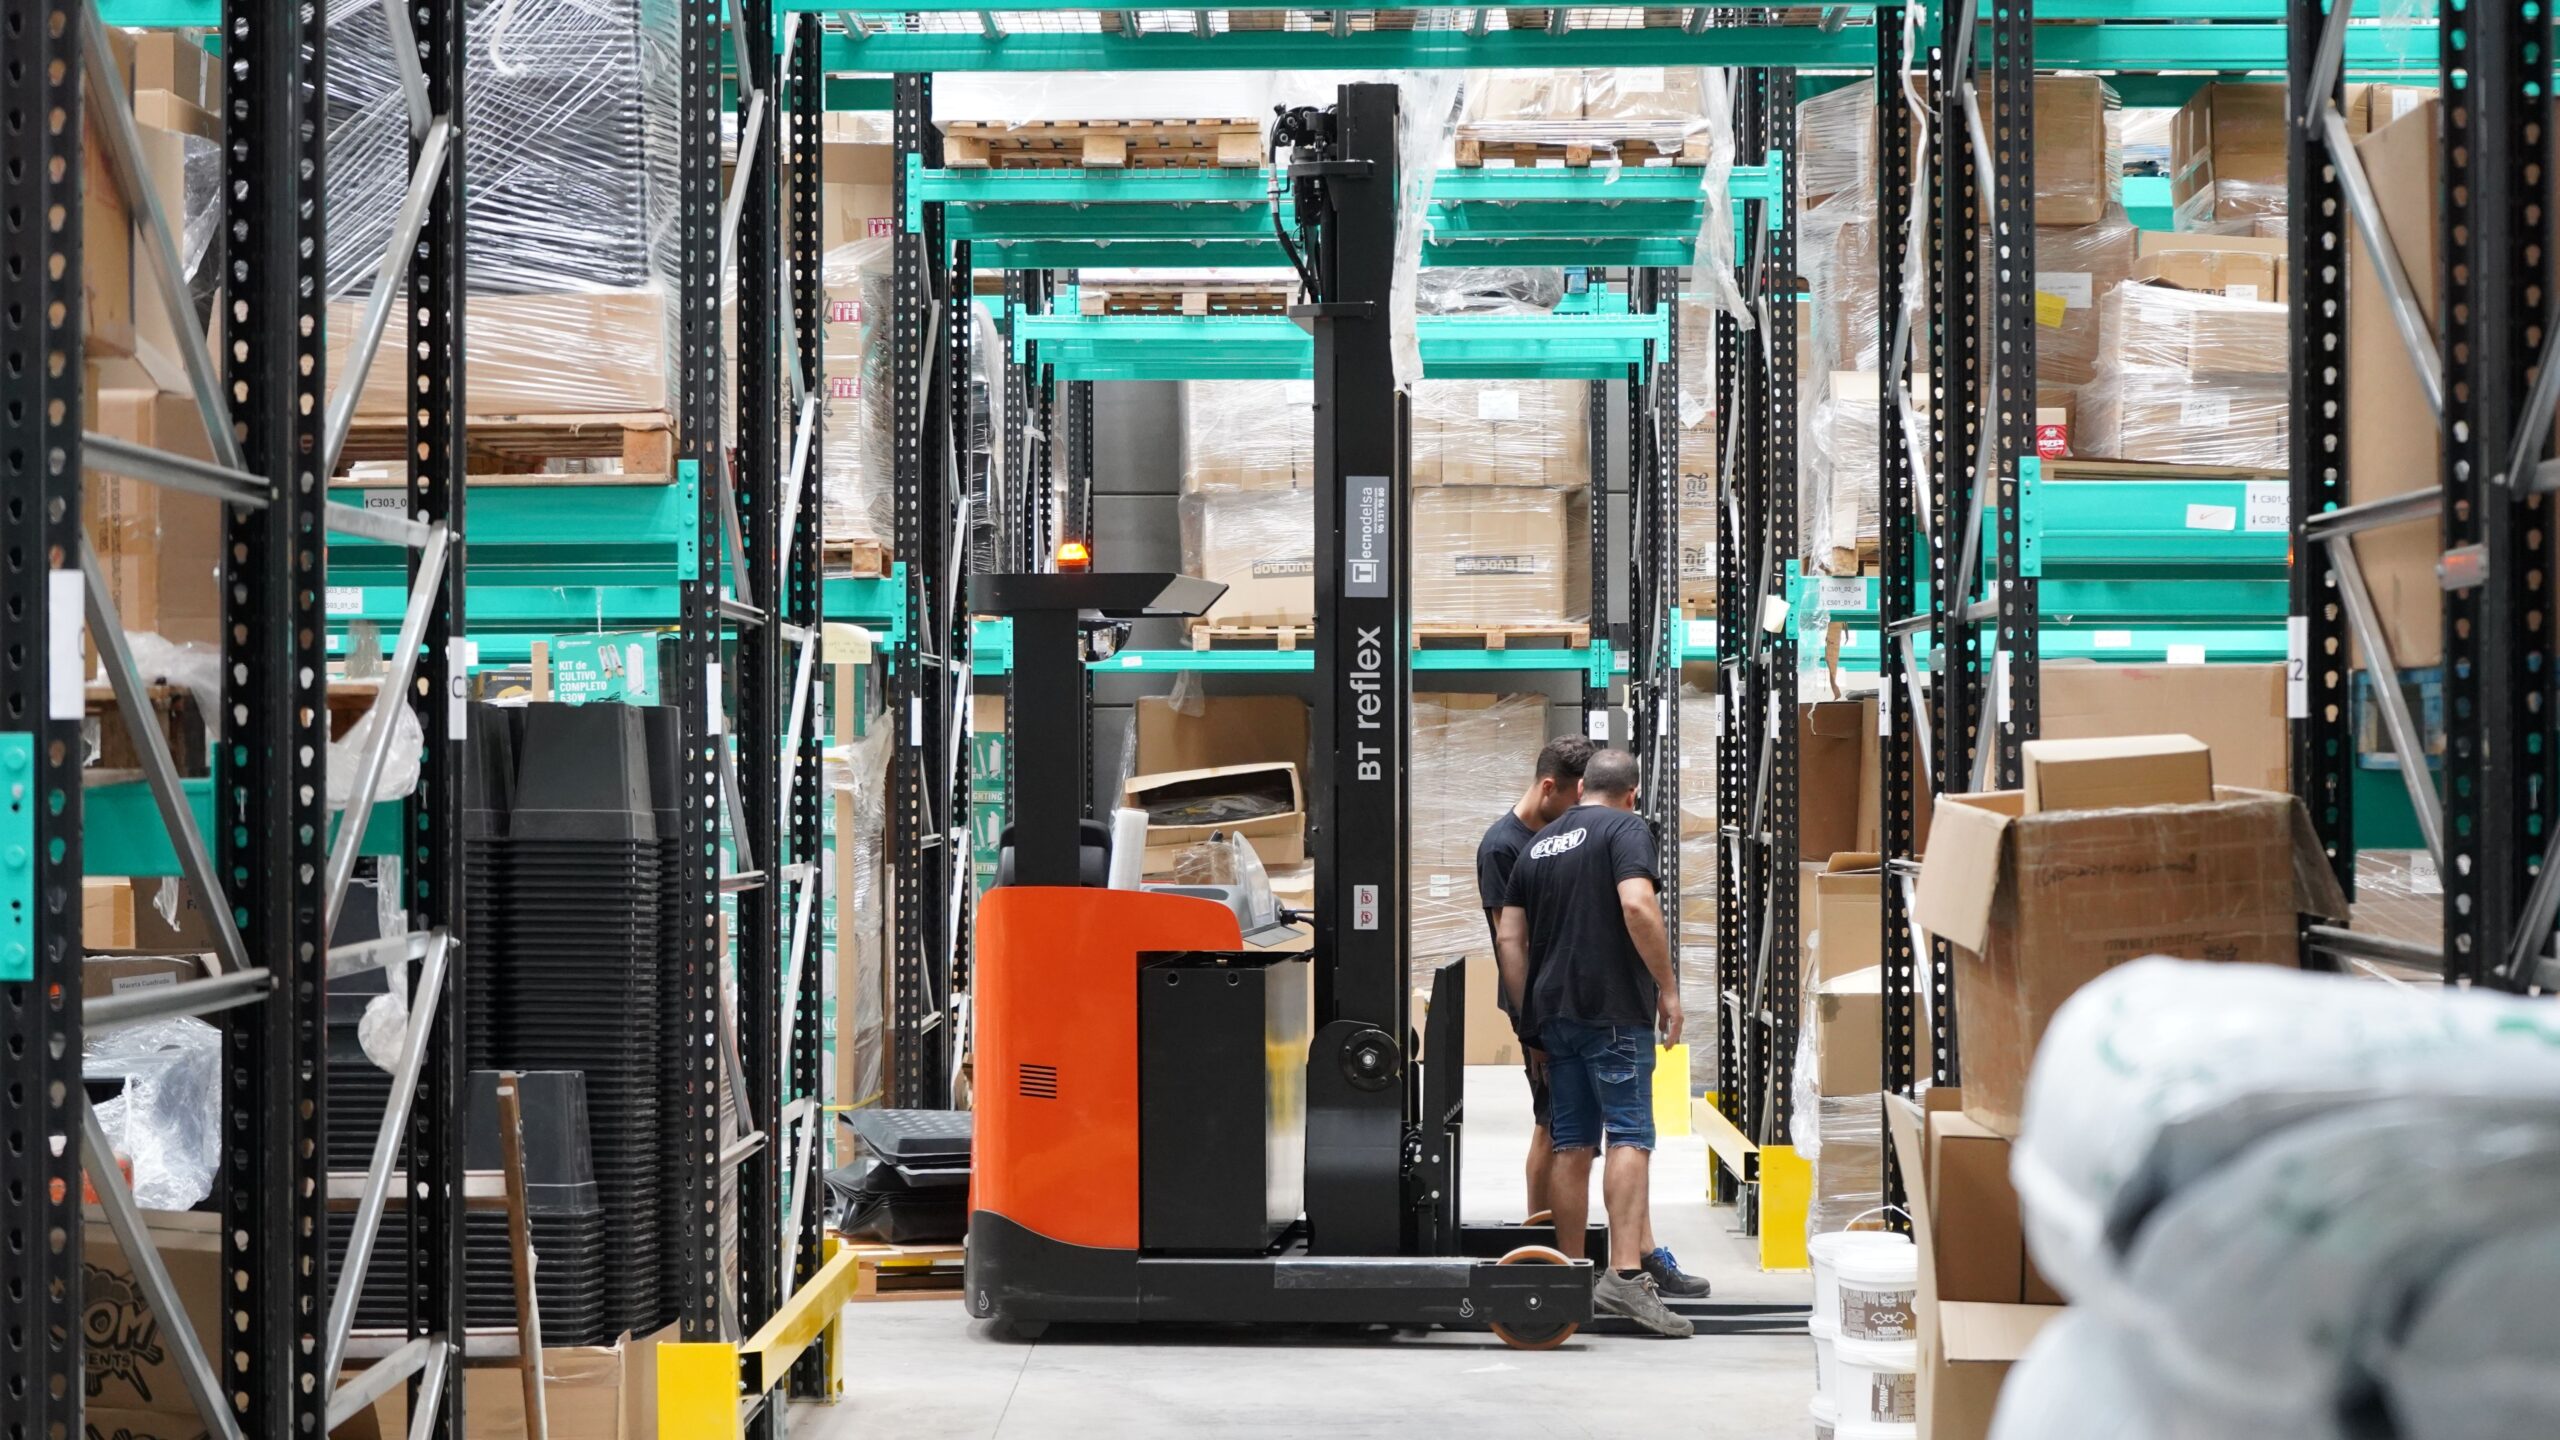
A second set of indexes tracks intermediate demand: products and services sold to businesses as inputs. Those measures can follow prices through four broad stages of production. Steel may become a component, the component may enter a machine, and the machine may become capital equipment. Mapping those stages helps economists see where a price shock entered the production chain and whether it continued moving forward.
Why a single PPI reading can jump
The September 2026 report offers a useful example of how to look beneath the headline. Final-demand goods prices rose 2.6 percent, while services rose 0.8 percent. More than four-fifths of the goods increase came from energy, whose index jumped 10.8 percent. Gasoline alone rose 20.3 percent, and diesel, jet fuel, crude petroleum, and residential electric power also moved higher.
Those figures describe a real price shock, but they do not mean every producer raised prices by 1.3 percent or that the same increase will repeat. Energy is volatile. A disruption can quickly affect crude oil, refined fuels, freight, and airline services, then reverse as supply conditions change. Food prices can also swing because of weather, disease, harvest timing, and global commodity markets.
That is why BLS also publishes an index for final demand excluding food, energy, and trade services. It rose 0.5 percent in September. Removing those components does not make the remaining measure automatically true or better. It answers a different question by reducing some of the categories that can dominate a single month. The headline shows the price movement producers actually experienced across final demand; the narrower measure can make the underlying direction easier to see.
Monthly and yearly changes also tell different stories. A one-month figure is timely but sensitive to short-lived movements. The 12-month figure is steadier, yet it depends on what happened exactly a year earlier. Reading both, along with several previous months, is more informative than treating one number as a verdict on inflation.
Why PPI and CPI do not move together
The Consumer Price Index begins at the other end of many transactions. It measures changes in prices paid by urban consumers for a basket of goods and services. PPI measures prices received by domestic producers. A supermarket sale can therefore appear in both systems, but from different perspectives and with different weights.
The scopes also differ. Final-demand PPI includes domestic output sold to businesses, governments, and foreign buyers, not only items bought by households. It excludes imported production because the seller is not a domestic producer. CPI includes imported consumer goods when households buy them. CPI also gives substantial weight to shelter, including a measure of the rental value of owner-occupied homes, while that concept has no direct counterpart in final-demand PPI.
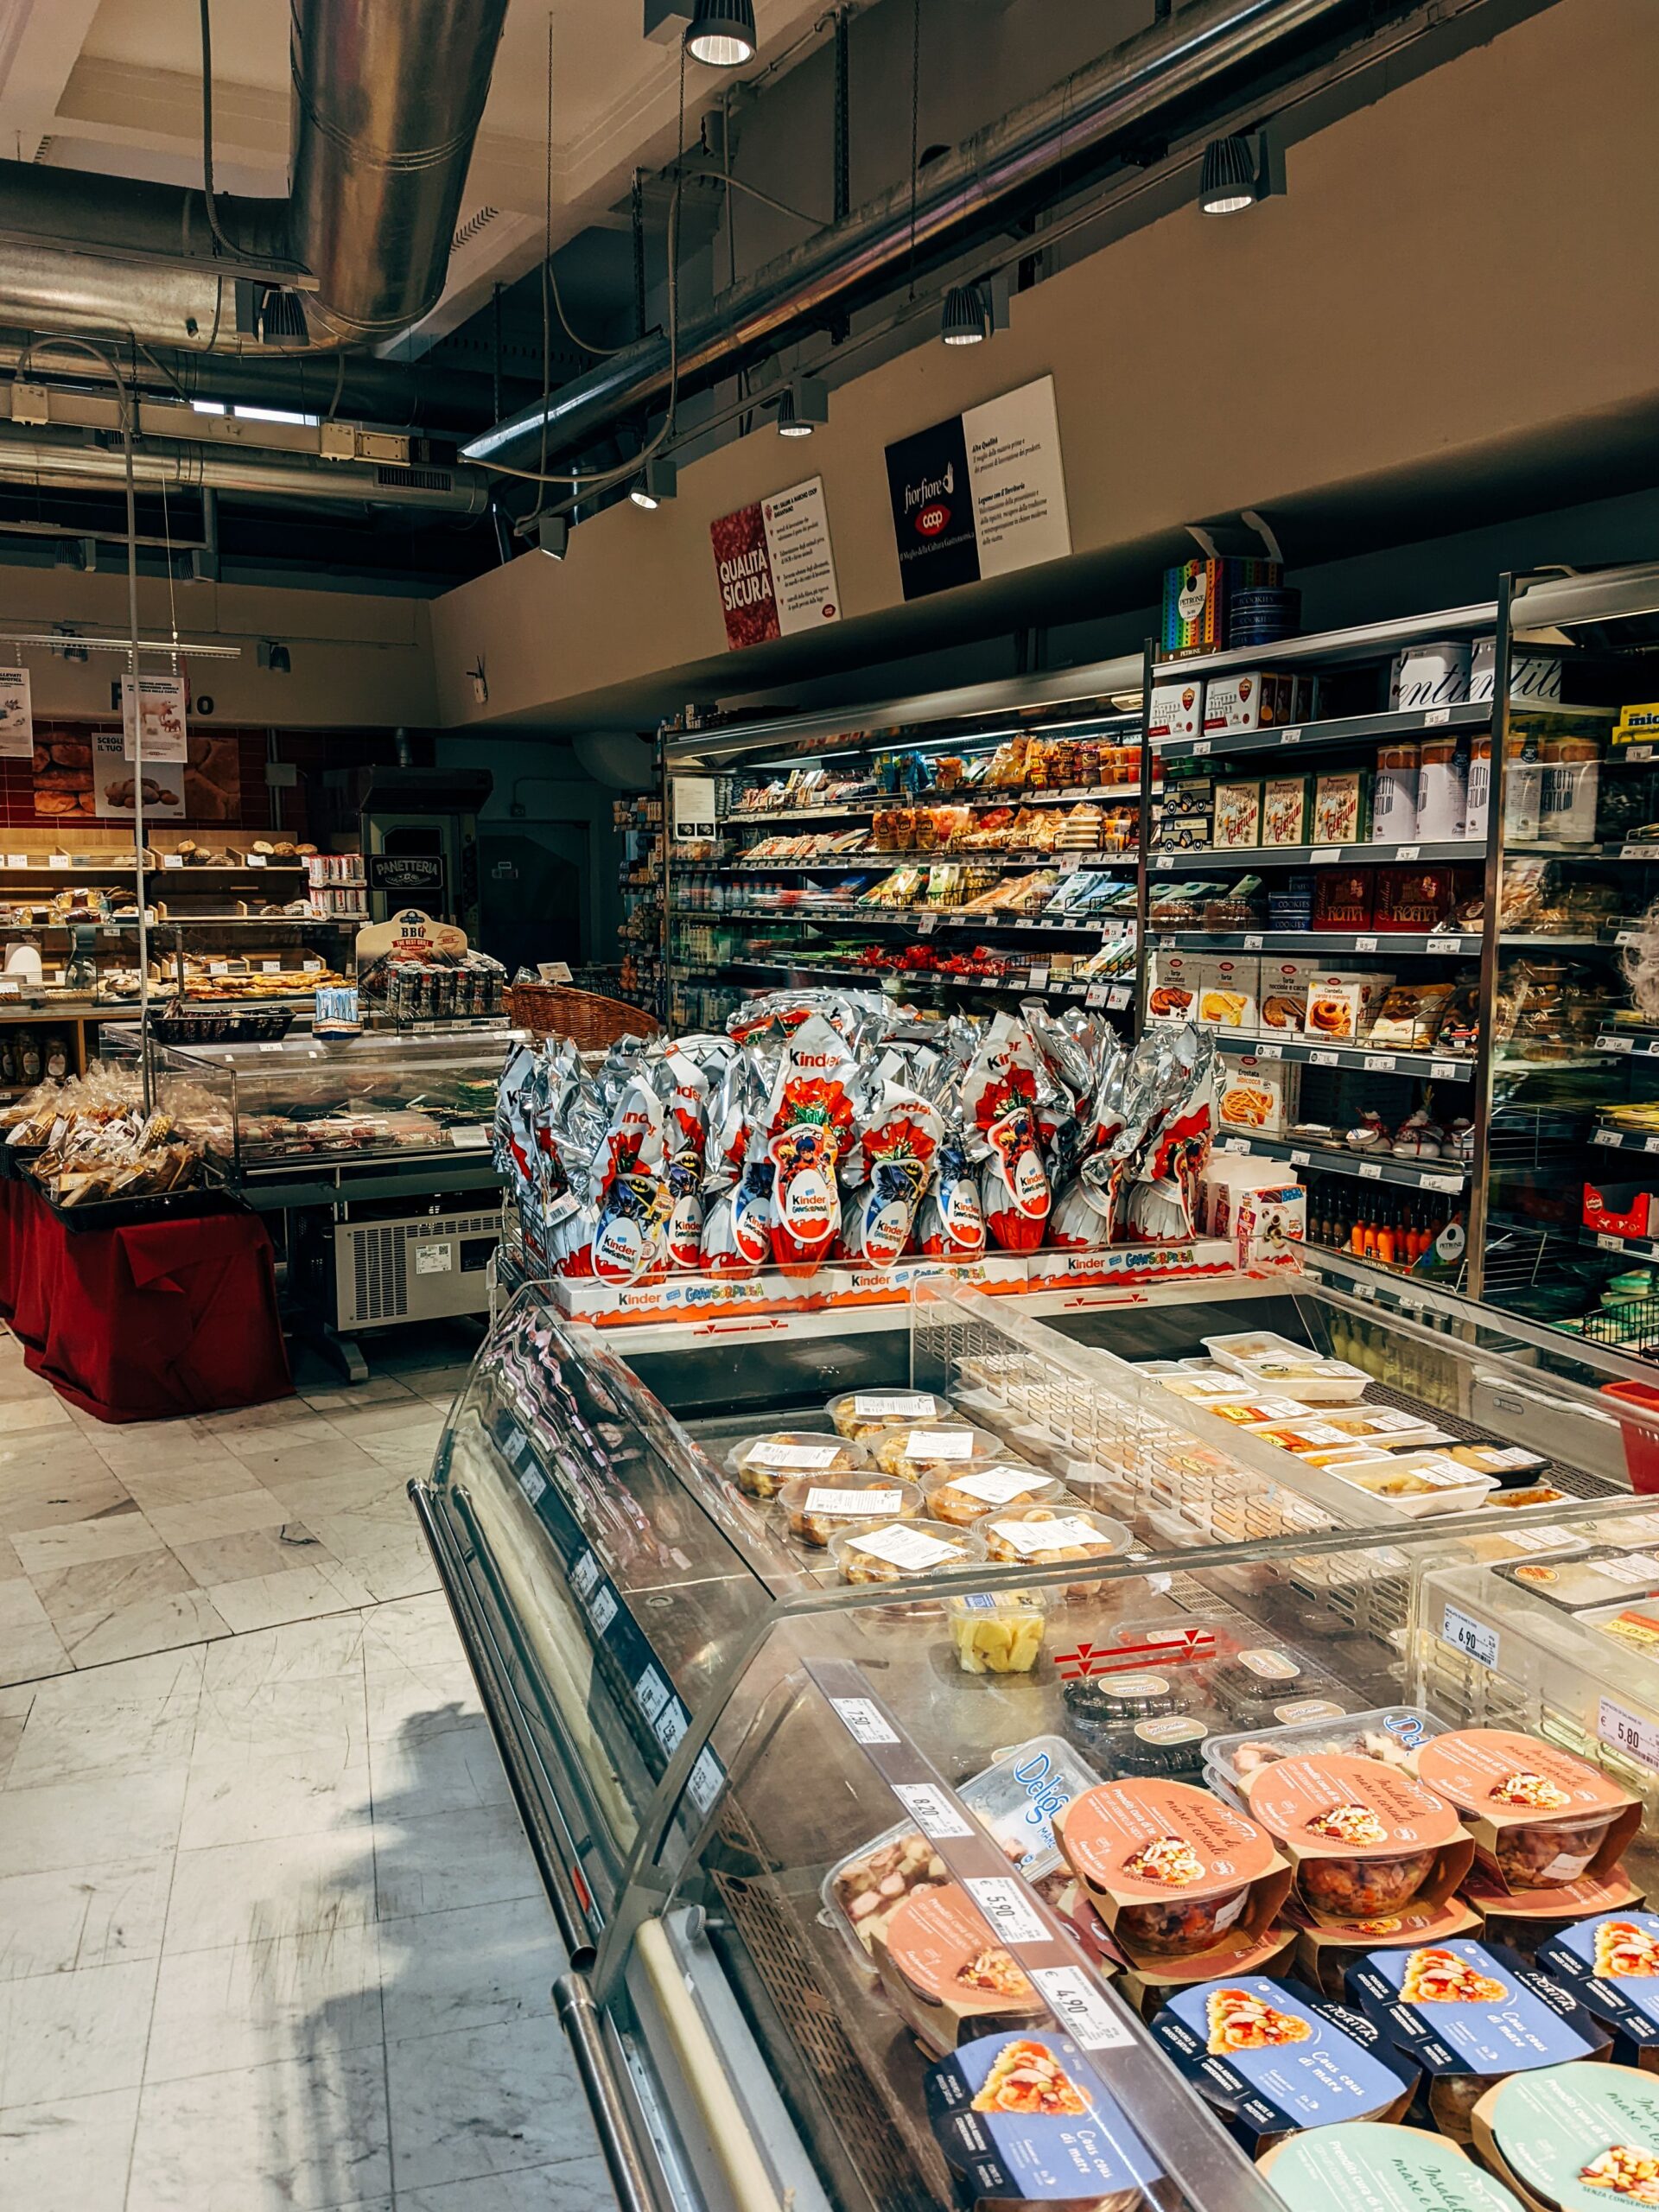
Taxes and distribution can create more distance. CPI includes sales and excise taxes that are directly tied to a consumer purchase. PPI generally measures the producer’s net selling price. A retailer may absorb a supplier increase by accepting a smaller margin, or it may raise its own markup even when the factory price is stable. The two indexes can therefore move in the same direction without matching in size or timing.
This is also why describing PPI as wholesale inflation is incomplete. The name was changed from Wholesale Price Index to Producer Price Index in 1978, and the current final-demand system includes many services and construction activities that are not ordinary wholesale transactions. The convenient label hides much of what the index now measures.
When producer price pressure reaches households
A higher producer price can reach consumers, but there is no fixed pass-through rule. Imagine a food company paying more for grain, packaging, electricity, and freight. It may raise its selling price immediately, wait until a contract resets, redesign the package, switch suppliers, improve efficiency, or accept a lower profit margin. A retailer then faces the same menu of choices before deciding what shoppers pay.
Market conditions shape that decision. A business with strong demand and few competitors may pass on an increase more easily. A company selling a product with many close substitutes may fear losing customers. Long-term contracts can delay changes, while spot markets transmit them quickly. Productivity gains, inventory purchased at older prices, and falling costs elsewhere can offset pressure from one input.
Some PPI movements never reach household prices at all. A rise in equipment sold to businesses may affect investment spending rather than consumer purchases. Higher export prices concern foreign buyers. Government procurement has its own contracts and budgets. Even within consumer goods, an increase early in the chain may disappear if a later stage becomes cheaper or a firm trims its margin.
The index is still valuable as an early view of the price system. Intermediate-demand data can reveal pressure among raw materials, processed inputs, freight, and business services before the final retail outcome is known. Analysts combine that evidence with CPI, import prices, wages, productivity, inventories, and demand. PPI is a signal in that larger picture, not a mechanical prediction.
How to read the next PPI report
Start by identifying the time period. News reports often place the seasonally adjusted one-month change beside the unadjusted 12-month change. That is standard practice, but the figures answer different questions. Seasonal adjustment removes patterns that tend to recur at the same time each year, which helps with month-to-month comparison. The yearly measure looks past seasonal effects by comparing the same month across years.
Then check what drove the change. Separate goods from services, and look for unusually large contributions from energy, food, transportation, or trade margins. Compare the headline with the measure excluding food, energy, and trade services. If the two diverge sharply, the details matter more than the headline alone.
Finally, look for persistence and revisions. PPI figures for recent months can be revised as late reports and corrections arrive. One surprising reading deserves attention; several months moving in the same direction provide stronger evidence of a trend. Intermediate stages can add context, but they should not be added together because the same product may appear at more than one point in production.
The Producer Price Index is most useful when read as a map of transactions rather than a consumer-price prophecy. It shows where domestic producers are receiving more or less for their output, how pressure differs across goods and services, and which stages of production are changing. Pairing that map with CPI and the report’s underlying details turns a dramatic inflation number into something much more informative.