 Akshay Dinesh
A buoy rocking miles offshore may look like a lonely scientific instrument, but its measurements can affect when a cargo ship enters port, whether a fishing vessel leaves the dock, and how a coastal town prepares for flooding. The same is true of tide gauges, underwater gliders, satellite feeds, sonar surveys, and computer models. Together, they produce the information that makes activity on the water safer and more predictable. A growing group of businesses turns those observations into instruments, maps, forecasts, software, and specialized advice. Economists and ocean agencies call this group the ocean enterprise.
The name is easy to confuse with the much larger ocean or blue economy. They are connected, but they are not interchangeable. The ocean economy includes activities such as tourism, shipping, fishing, shipbuilding, offshore energy, and marine construction. The ocean enterprise is the information layer underneath many of them: the companies and nonprofit organizations that measure the ocean or transform measurements into products people can use.
A small sector behind a much larger economy
In October 2026, the National Oceanic and Atmospheric Administration released its U.S. Ocean Enterprise in 2025 report. The study identified more than 1,800 businesses involved in ocean-observing products and services, up 75 percent from the number identified in 2020. NOAA estimated their ocean-enterprise revenue at about $16.4 billion a year, a 50 percent increase over the earlier study. Roughly $3.5 billion, or 21 percent, involved exports.
Those figures describe a specialized business cluster, not every company that earns money from the sea. An instrument maker that builds wave sensors belongs to the ocean enterprise. So does a firm that combines currents, winds, and vessel positions into routing software. A seaside hotel normally does not, even though coastal tourism is part of the broader ocean economy. The distinction matters because it shows how information can support industries far larger than the firms that collect and process it.
The Bureau of Economic Analysis measured the broader U.S. marine economy at $511 billion in value added, or GDP, in 2023. Its gross output reached about $827 billion, with approximately 2.6 million jobs. NOAA’s newer Open Economics: National Ocean Watch dataset uses a different method and estimates about 3.7 million marine-economy jobs in 2024. These totals should not be treated as competing answers without checking their definitions. Both, however, point to the scale of the activity that depends on oceans, coasts, seaports, and the Great Lakes.
From a measurement to a decision
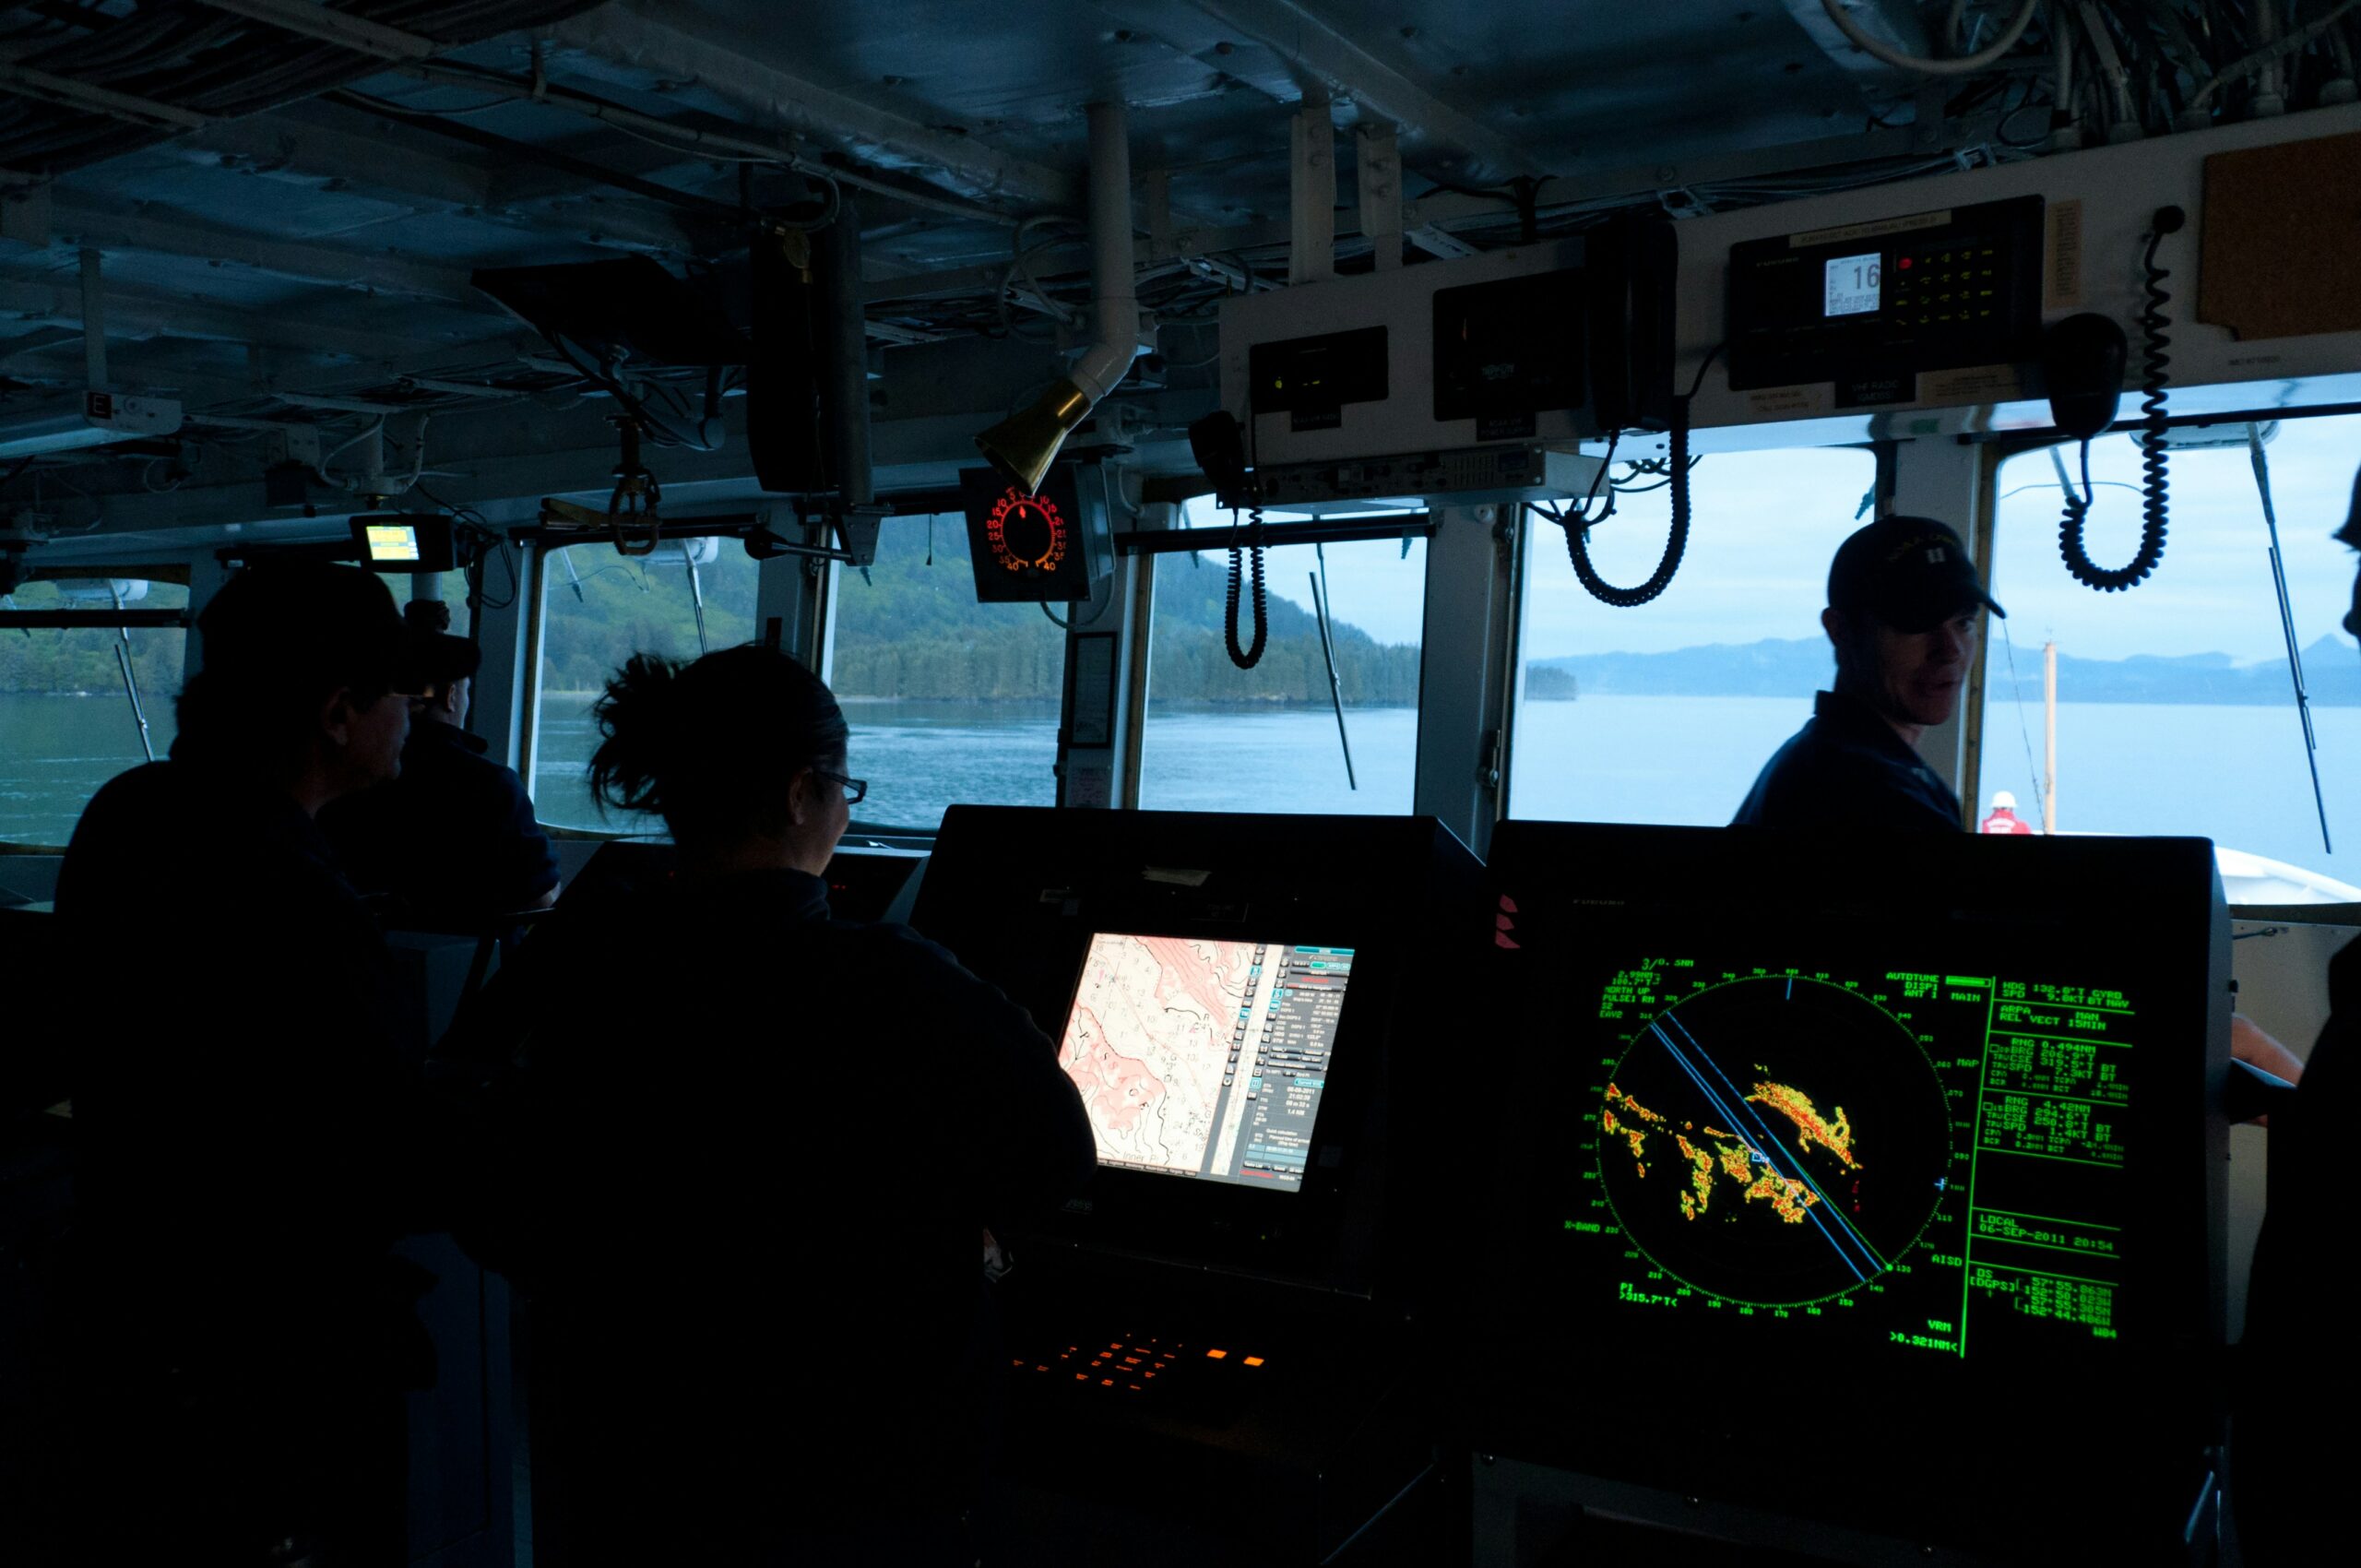
Raw ocean data rarely arrives as a neat answer. A sensor may record wave height every few minutes. A tide gauge tracks the changing water level at one location. A current meter measures the speed and direction of moving water, while a multibeam sonar system maps the depth and shape of the seafloor. Satellites add wide views of sea-surface temperature, winds, ice, and ocean color. Each observation covers only part of the picture and carries its own limits.
The next step is to check the data, combine it with other observations, and place it in a model or map. That work turns scattered measurements into a forecast of waves at a harbor entrance, a chart showing safe water depths, or an alert that unusually high tides could flood a road. A product may be as simple as a dashboard or as specialized as a route recommendation for one vessel. Its value comes from reducing uncertainty before someone commits time, fuel, equipment, or people.
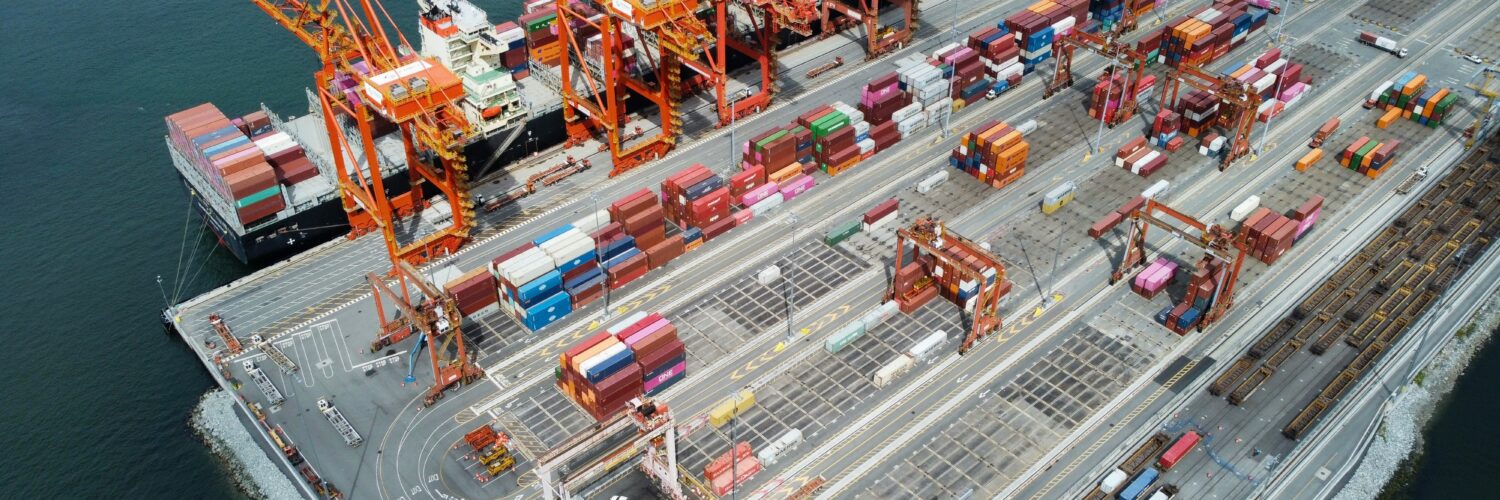
Consider a container ship approaching a crowded port. Accurate depth information helps determine whether the vessel has enough clearance beneath its keel. Current and wind forecasts help pilots plan a safe approach, while wave observations can influence when cranes operate or when a ship should wait offshore. Better timing cannot eliminate weather or mechanical risk, but it can reduce delays, fuel use, and avoidable danger. The information is part of the port’s working infrastructure even though it is less visible than a channel, crane, or dock.
One stream of data, many users
The same observation can create value in several places. A wave buoy may help the National Weather Service issue a marine forecast, a shipping company plan a route, a harbor decide whether conditions are safe, and a surfer judge the day’s swell. Sea-level records support flood warnings, engineering standards, insurance analysis, and long-term planning. Water-temperature and ocean-color measurements can help researchers track harmful algal blooms and guide decisions by fisheries managers, aquaculture operators, and beach officials.
Tourism shows why the information layer should not be mistaken for a niche concern. NOAA’s Open ENOW estimates identify tourism and recreation as the largest source of marine-economy employment. Hotels, charter boats, restaurants, and beach businesses do not all buy ocean instruments, but their customers and operations depend on usable forecasts, safe navigation, clean water, and timely hazard warnings. Reliable information supports the conditions under which those businesses can operate.

Some uses are less immediate but just as important. Years of shoreline, storm, and water-level data help engineers decide where structures should be placed and how high they need to be. Repeated seafloor surveys reveal hazards and changes in navigation channels. Long records allow scientists to separate a passing event from a persistent trend. A measurement collected for today’s forecast can become evidence for a decision made decades later.
Why public data and private products grow together
Ocean observing often begins with public infrastructure. Federal and state agencies maintain satellites, buoys, tide gauges, survey ships, weather models, and data archives because broad, continuous coverage benefits many users at once. It would be inefficient for every port, fisher, researcher, and coastal town to build a separate observing system. Public data also gives scientists and businesses a common foundation rather than a collection of isolated measurements that cannot easily be compared.
Private firms add instruments, coverage, speed, and specialization. One company may design a tougher sensor, another may operate autonomous vehicles, and another may convert public and commercial feeds into a tool for offshore construction. Customers are often paying for the interpretation, reliability, interface, or decision support rather than for a single number. NOAA’s report describes this relationship as a source of partnership: agencies can test and validate technology, while businesses can move products into particular markets and develop them rapidly.
This arrangement also explains why open data can encourage business rather than crowd it out. A freely available tide record does not automatically tell a marina how to manage a coming storm, and a global weather model does not provide every vessel with an optimized voyage. When foundational observations are accessible, firms can spend more effort on analysis and useful products. The result resembles other information industries in which public maps, standards, or research support private services built for specific users.
Reading ocean-economy numbers carefully
Large economic figures can look precise while describing different things. Revenue is the money organizations receive from sales. Gross output counts the value of goods and services produced, including sales between businesses. GDP, or value added, subtracts the value of inputs used up in production, which helps prevent the same activity from being counted repeatedly. Employment totals can also change depending on whether a dataset counts jobs, workers, self-employed people, or businesses located only in coastal areas.
Time periods matter too. A 50 percent rise in estimated ocean-enterprise revenue since 2020 is a nominal-dollar comparison unless the report adjusts it for inflation. Changes in methods and improved business identification may also affect the count. NOAA’s studies are especially useful for showing the size and direction of a hard-to-see sector, but the numbers deserve the same questions applied to any economic statistic: What is included? What year does it cover? Is it adjusted for price changes? Was the method consistent?
Asked carefully, those questions make the larger story clearer. The ocean economy is not only ships, seafood, beaches, and offshore structures. It also depends on a chain that begins with observation and ends with a decision. Sensors, surveys, models, and forecasts help people use marine spaces with less uncertainty. The companies that build that chain may represent a modest share of the dollars earned from the ocean, yet their information travels through nearly every part of it.