 Akshay Dinesh
El Niño begins in the tropical Pacific, but its temperature influence does not stay neatly inside one strip of ocean. When the central and eastern equatorial Pacific warm, the atmosphere above them changes too. Rainfall zones shift, winds reorganize, and heat that had been stored in the ocean can move into the air. That is why a powerful El Niño can help push global average temperatures higher months after the ocean pattern first becomes obvious.
The delay matters in 2026 because climate agencies are watching a rapidly strengthening El Niño. NOAA’s National Centers for Environmental Information reported on September 10, 2026, that August 2026 was the warmest August in the 1850-2026 global record, at 1.32 degrees Celsius above the 20th-century average. The World Meteorological Organization’s September 2026 El Niño update also said El Niño was very likely to persist through the Northern Hemisphere fall and winter and expected to strengthen before peaking near the end of the year. Those updates do not mean one climate pattern explains every hot month, but they do show why scientists pay close attention to timing.
The Ocean Warms Before the Whole Planet Responds
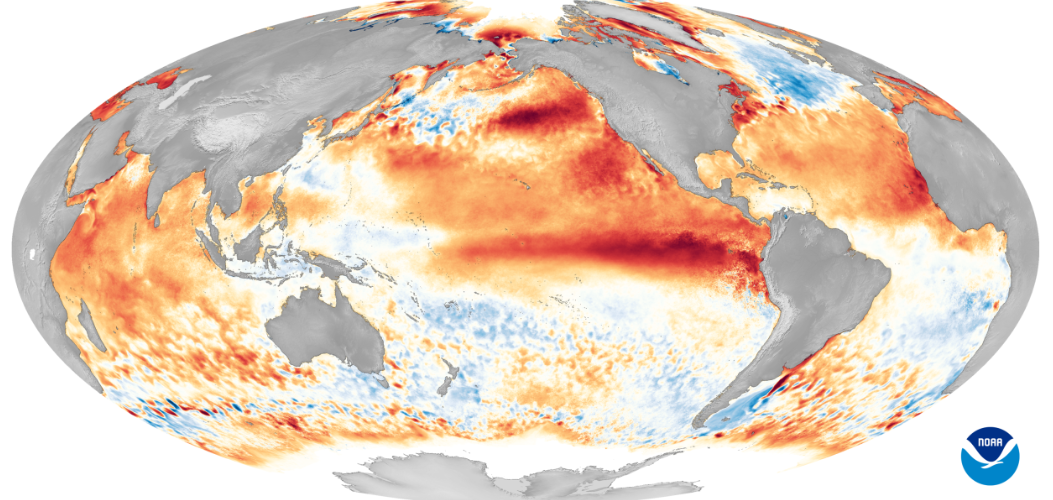
El Niño is part of the El Niño-Southern Oscillation, often shortened to ENSO. During the warm phase, surface waters in the central and eastern tropical Pacific become warmer than usual while the normal east-to-west trade winds weaken. NOAA and NASA often track this through the Niño 3.4 region, a band of ocean along the equator where temperature changes are especially useful for measuring ENSO strength.
The first signal is oceanic. Satellite sensors, buoys, and ship measurements show that the sea surface is warmer than the long-term average. But global average temperature measures the air near the surface over land and ocean, not just one ocean region. The planet’s temperature response takes time because heat has to move through connected systems: from ocean to atmosphere, from tropics to higher latitudes, and from seasonal wind patterns into weather patterns that cover large areas.
That is why the peak of an El Niño event and the peak of its global temperature influence are often separated. The tropical Pacific may reach its strongest warm anomaly in late fall or early winter, while the largest boost to global average temperature can show up in the following months or even the following year. The ocean changes first; the global thermometer catches the broader response later.
Stored Ocean Heat Moves Into the Air
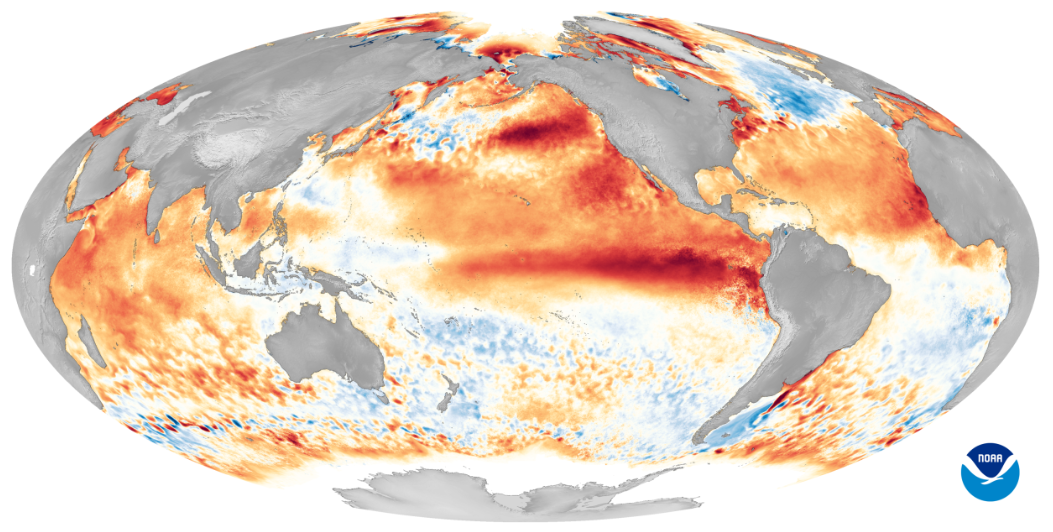
The ocean is Earth’s largest heat reservoir. Water can store far more heat than air, so a warming ocean region can hold an enormous amount of energy before people notice a clear atmospheric response. During El Niño, some of that stored heat becomes more available to the atmosphere because the normal tropical Pacific circulation weakens and warm surface water spreads eastward.
Warm water warms the air above it and adds moisture through evaporation. In the tropics, that extra warmth and moisture help fuel towering thunderstorms. Those storms move heat upward, releasing energy high in the atmosphere when water vapor condenses into cloud droplets and rain. The process is not just local weather over the Pacific; it helps rearrange winds across much larger regions.
NASA notes that sea surface height can also act as a clue to ocean heat because warmer water expands and takes up more volume. During El Niño, higher-than-usual sea surfaces in parts of the tropical Pacific can signal that extra heat is present in the upper ocean. That heat does not instantly become a global air-temperature record, but it becomes part of the climate background that can lift temperatures as the event matures.
Tropical Rainfall Changes the Planet’s Airflow
One reason El Niño has such reach is that tropical rainfall acts like a steering force for the atmosphere. Under ordinary conditions, the most active tropical convection often sits farther west over the warm waters near Indonesia and the western Pacific. During El Niño, that thunderstorm zone can shift eastward toward the central and eastern Pacific.
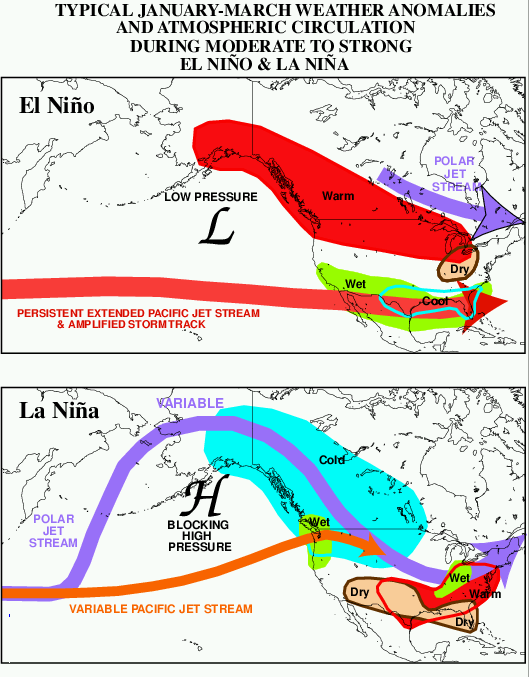
That shift changes where heat is released into the upper atmosphere. The atmosphere then responds with waves, pressure changes, and altered jet-stream patterns. These long-distance links are called teleconnections. They explain why a change near the equator can affect winter storm tracks, drought risk, rainfall patterns, and seasonal temperature odds far away.
Teleconnections also help explain the lag. Large-scale air circulation does not snap into a new global pattern the moment an ocean index crosses a threshold. The ocean and atmosphere reinforce each other over weeks and months. A strengthening El Niño can therefore keep shaping the climate after its first arrival, especially if the atmosphere is clearly responding to the warm Pacific rather than treating it as a temporary surface fluctuation.
Why the Following Year Can Stand Out
Some of the clearest global temperature records have occurred in years influenced by a mature or recently peaked El Niño. The strong 1997-98 El Niño was followed by a famously hot 1998. The powerful 2015-16 event helped lift 2016 to a major global temperature record at the time. The 2023-24 El Niño contributed to the exceptional warmth of 2024, which the World Meteorological Organization has described as the hottest year on record when combined with long-term human-caused warming.
The pattern is not magic and it is not identical every time. A calendar year is just a human way of dividing time, while an El Niño event often grows across one year and peaks during the Northern Hemisphere winter. If the event reaches maximum strength near November, December, or January, the strongest global temperature effect may spill into the next calendar year. That can make the year after development look especially warm in annual rankings.
There is another reason records can be easier to break now. El Niño rides on top of a warmer baseline. Greenhouse gases have raised the background temperature of the climate system, so a temporary El Niño boost starts from a higher level than similar events did decades ago. The warm phase of ENSO adds a short-term push; long-term warming determines how high the floor already is.
El Niño Is a Boost, Not the Whole Explanation
It is tempting to treat El Niño as the explanation for every hot month during an active event, but that goes too far. ENSO is the largest natural source of year-to-year variation in global temperature, yet it is only one part of the climate system. Volcanic aerosols, solar variation, ocean heat outside the tropical Pacific, polar sea ice, land conditions, and ordinary weather variability can all affect monthly and yearly rankings.
Human-caused warming is the deeper trend. El Niño can temporarily raise global temperature above that trend, while La Niña can temporarily pull it down. Neither one cancels the underlying direction. A recent La Niña year can still be warmer than an El Niño year from decades earlier because the baseline has moved upward.
This distinction makes climate updates easier to read. When agencies report a record-hot month during El Niño, the event may be part of the reason the record happened at that moment. It is not proof that natural cycles explain the long-term warming trend. The better picture is layered: a warming climate sets the stage, stored ocean heat adds fuel, and El Niño can time the release in a way that makes certain months or years stand out.
Reading Future Temperature Headlines Carefully
When El Niño is forecast to become very strong, global temperature headlines often become more likely, but the right question is not whether El Niño will make every place hot. Global average temperature is a single number summarizing conditions across land and ocean. A record global month can happen while some regions are cooler than average, just as a warm winter pattern can include local cold snaps.
Pay attention to the time window. A monthly record, a seasonal outlook, and an annual temperature ranking are different kinds of information. A monthly record may reflect a brief alignment of ocean warmth, atmospheric circulation, and regional extremes. An annual record requires warmth to persist across many months. A forecast for the following year carries more uncertainty because it depends on how strong El Niño becomes, when it peaks, how quickly it fades, and what other climate factors do at the same time.
The most useful takeaway is that El Niño’s global temperature effect is delayed because the ocean and atmosphere are coupled, not instantaneous. Warm water changes tropical thunderstorms; thunderstorms change airflow; airflow changes weather patterns; and the global average responds as those changes spread. That delay is why scientists watch not only whether El Niño has developed, but how strongly it is coupled to the atmosphere and when its peak is likely to arrive.