 Akshay Dinesh
A coordinate plane is one of algebra’s most useful translation tools. It takes a place, a movement, or a relationship and turns it into numbers that can be graphed, compared, and studied. A point on a flat surface no longer has to be described with vague words like “over there” or “a little higher.” It can be written as an ordered pair, such as \((3, -2)\), that tells exactly how far to move sideways and how far to move up or down.
That simple idea connects several parts of math that students often meet separately. Number lines, maps, tables, equations, slopes, and graphs all begin to work together once a coordinate plane is in view. The grid is not just a place to draw answers. It is a way to make location behave like algebra.
The Two Number Lines That Make a Plane
A coordinate plane starts with two number lines crossing at right angles. The horizontal number line is the x-axis, and the vertical number line is the y-axis. Their crossing point is the origin, written as \((0,0)\). From that center point, positive x-values move to the right, negative x-values move to the left, positive y-values move up, and negative y-values move down.
The key change is that one number line can only describe movement in one direction. A single number like 4 can tell a position on a line, but it cannot tell a location on a sheet of paper, a screen, or a map. A flat surface needs two directions. The coordinate plane supplies both directions at once.
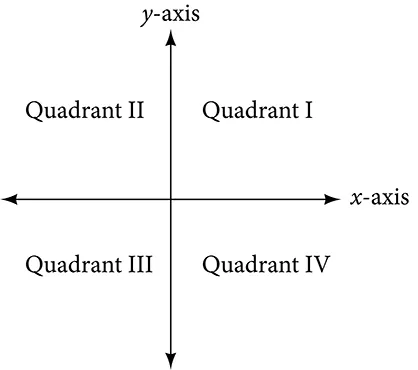
The axes divide the plane into four regions called quadrants. Quadrant I is where both coordinates are positive. Quadrant II has negative x-values and positive y-values. Quadrant III has two negative coordinates, and Quadrant IV has positive x-values with negative y-values. Those signs are not decoration; they tell the direction of the movement from the origin.
Why Ordered Pairs Have to Stay in Order
A point on the coordinate plane is written as an ordered pair in the form \((x,y)\). The word ordered matters because the first number and second number have different jobs. The first number tells horizontal movement. The second number tells vertical movement. Switching them usually changes the point.
For example, \((4,1)\) means move 4 units right and 1 unit up. The pair \((1,4)\) means move 1 unit right and 4 units up. Both points are in Quadrant I, but they are not the same location. A common graphing mistake is to treat the two numbers as interchangeable because they look similar on paper. On the grid, they land in different places.
The signs matter just as much as the order. The point \((-3,2)\) begins by moving 3 units left, then 2 units up. The point \((3,-2)\) moves 3 units right, then 2 units down. The numbers 3 and 2 appear in both, but the signs send the points into different quadrants. A coordinate plane turns sign rules into visible movement, which is one reason it helps students catch errors that might stay hidden in a table.
Plotting a Point Is a Small Two-Step Story
To plot a point, start at the origin rather than guessing from the edge of the graph. Read the x-coordinate first and move left or right. Then read the y-coordinate and move up or down. Mark the point only after both movements are complete.
Suppose the point is \((-2,4)\). Start at \((0,0)\), move 2 units left because the x-coordinate is negative, then move 4 units up because the y-coordinate is positive. The point lands in Quadrant II. For \((3,-1)\), move 3 units right and 1 unit down, which places the point in Quadrant IV. For \((0,5)\), there is no left-or-right movement, so the point sits directly on the y-axis.
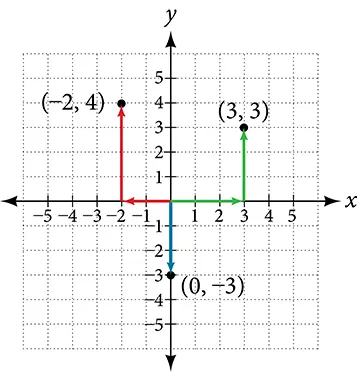
Points on the axes have a pattern worth remembering. If the x-coordinate is 0, the point is on the y-axis, because it never moves sideways from the origin. If the y-coordinate is 0, the point is on the x-axis, because it never moves up or down. That means \((0,-6)\) and \((7,0)\) are not missing information; they are axis points.
From Separate Points to Patterns
Plotting one point is useful, but algebra becomes more powerful when many points create a pattern. An equation such as \(y = 2x + 1\) gives a rule for pairing x-values with y-values. Choose an x-value, calculate the matching y-value, write the ordered pair, and plot it. A few points can reveal the shape of the relationship.
For \(y = 2x + 1\), if \(x = 0\), then \(y = 1\), so one point is \((0,1)\). If \(x = 1\), then \(y = 3\), giving \((1,3)\). If \(x = -1\), then \(y = -1\), giving \((-1,-1)\). When those points are graphed, they line up because the equation describes a linear relationship.
This is where the coordinate plane starts to feel less like a blank grid and more like a bridge. A table shows pairs of numbers. An equation shows a rule. A graph shows the same relationship as a shape. Students who can move among those three views can check their work from more than one angle. If the table has a mistake, the graph may look uneven. If the graph does not match the equation’s pattern, the calculation may need another look.
Why Scale Changes the Meaning of a Graph
Coordinate planes are flexible, which makes them useful but also easy to misread. The marks on the x-axis and y-axis do not always have to count by ones. A graph about years and population might put years on the x-axis and millions of people on the y-axis. A graph about a trip might use minutes on one axis and miles on the other. The plane is the same structure, but the units change the story.
That is why reading the labels and scale matters before interpreting a graph. A line that looks steep on one graph may look flatter if the y-axis is stretched differently. Two points that seem close together may represent a large difference if each grid mark stands for 100 or 1,000. The coordinate plane gives precision only when the scale is understood.
The same caution applies when drawing a graph. Equal spacing should mean equal numerical steps along an axis. If one square means 1 unit near the origin but 5 units farther away, the graph becomes misleading unless the break is clearly marked. Good graphing is not just about placing points neatly. It is about making the picture tell the same truth as the numbers.
Where Coordinate Planes Show Up Outside Homework
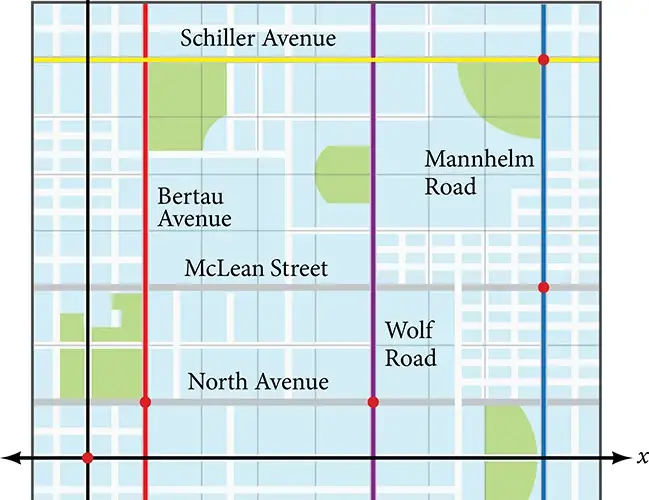
Coordinate planes are useful because the world is full of locations and relationships. A map can use grid lines to name a place. A video game can store a character’s position with horizontal and vertical coordinates. A designer can place text or images on a screen by using coordinate-like values. A scientist can graph time and temperature to see how quickly something changes.
In each case, the basic idea is familiar: one direction is not enough. To locate something on a flat surface, two pieces of information are needed. To study how two quantities relate, a graph makes the relationship visible. The coordinate plane gives math a working space where numbers can become pictures and pictures can be checked with numbers.
Learning the coordinate plane well also makes later algebra easier. Slope depends on changes in x and y. Linear equations become lines. Inequalities can shade regions. Systems of equations can meet at an intersection point. Even more advanced topics, from vectors to computer graphics, build on the same habit of describing position carefully.
The best way to think about a coordinate plane is not as a page of tiny squares. It is a language for location. The x-coordinate says how far sideways. The y-coordinate says how far vertically. Together, they let a point be named, moved, compared, and connected to a larger pattern. Once that clicks, a graph stops being a picture added after the math and becomes part of the math itself.