

 Akshay Dinesh
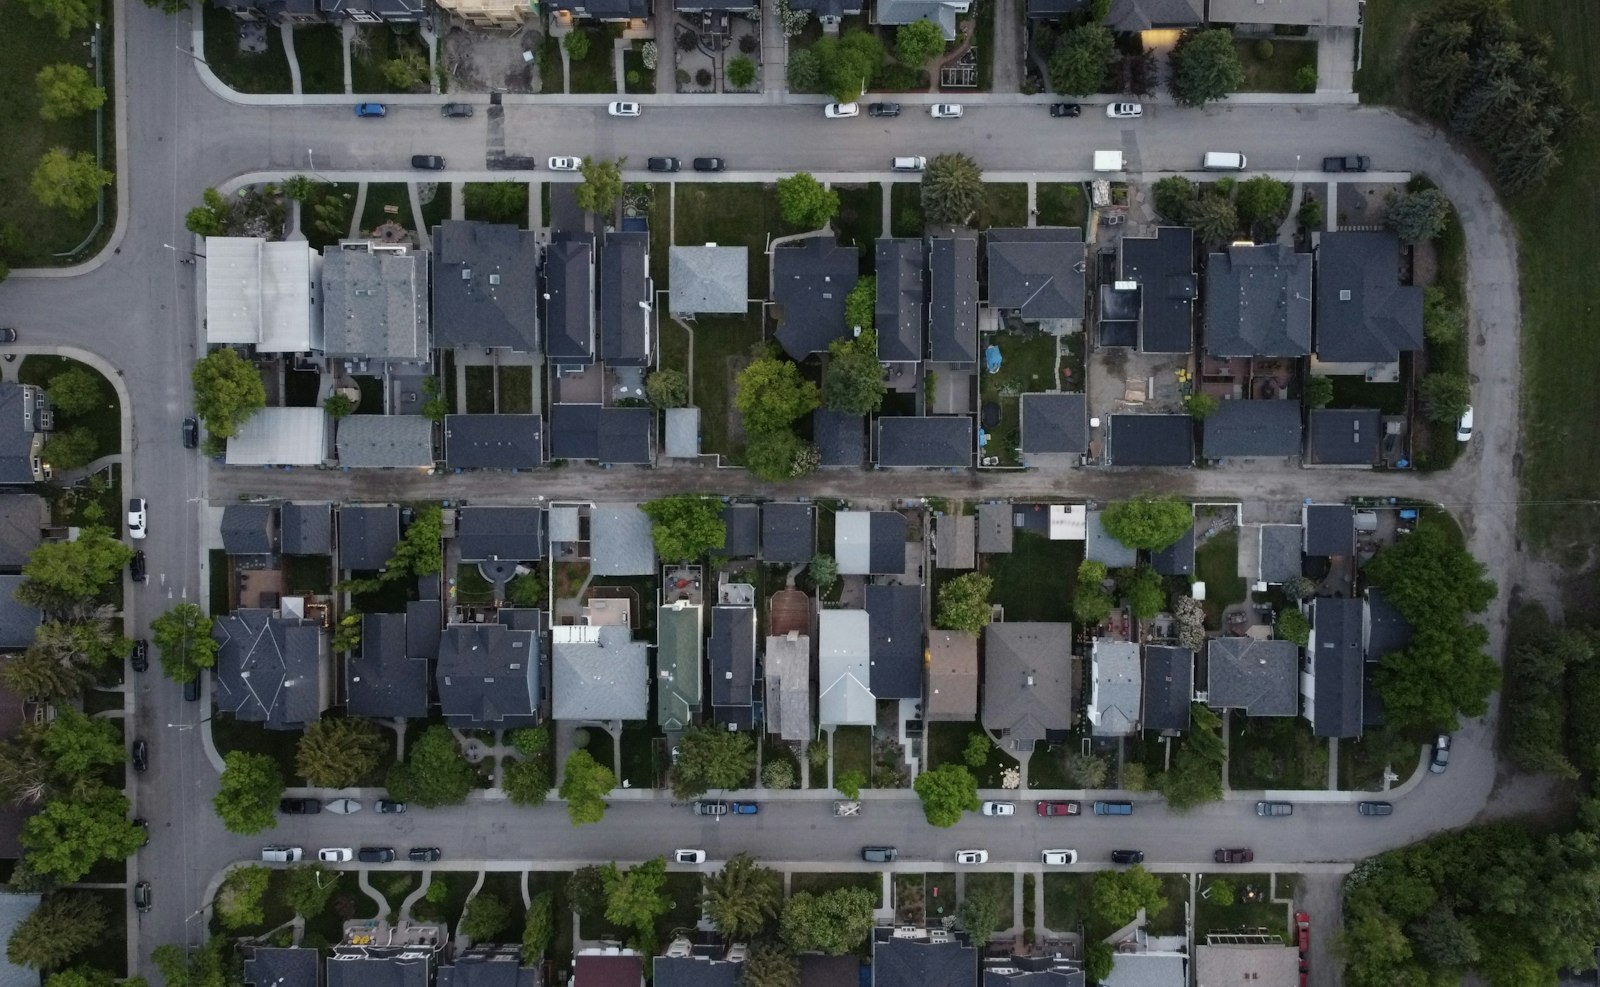
A map shows that neighborhoods with more bicycle commuters also tend to have higher average incomes. Does that mean the people riding bicycles are the higher earners? Perhaps, but the map alone cannot tell us. It compares neighborhoods, not the incomes and travel choices of the same people.
That leap from a group pattern to an individual conclusion is called the ecological fallacy. The word “ecological” refers here to groups or areas, not necessarily to the natural environment. The problem appears in election maps, school comparisons, public-health reports, and any other setting where totals stand in for individual records. A group statistic can be accurate and useful while a claim about the people inside the group is unsupported.
What group totals leave out
Imagine a neighborhood with 100 residents. A survey reports that 60 cycle to work and 60 have a high income. Those totals do not tell us how many people belong to both groups. At least 20 must be in both: even if all 40 people without a high income cycle, another 20 cyclists must come from the high-income group. At most 60 can be in both, because there are only 60 cyclists and 60 high-income residents.
Both extremes fit the same published totals. In one possible arrangement, 20 high-income and 40 other residents cycle; in another, all 60 cyclists have high incomes. The missing detail is the joint distribution: which income and commuting characteristics occur together in the same people. Knowing each total separately is not the same as knowing the overlap.
Now compare many neighborhoods. If high-income neighborhoods have more cyclists, that is a relationship between neighborhood measures. It might reflect individual income and travel choices, but it could also reflect bike lanes, transit connections, housing patterns, or other features of the places. The neighborhood-level pattern does not identify which explanation is correct.
A famous census example
In a 1950 analysis, sociologist W. S. Robinson compared information from the 1930 U.S. census. Across states, a larger foreign-born share was associated with a higher literacy rate. At the individual level, however, the relationship went in the opposite direction: foreign-born residents in the census were less likely to be recorded as literate than native-born residents. The two comparisons used the same population but answered different questions.
Statistician David Freedman’s account reports a state-level correlation of about 0.53 and an individual-level correlation of about −0.11 for residents aged ten and older. One reason for the reversal was that foreign-born residents tended to live in states where native-born residents also had relatively high literacy rates. The figures are historical observations, not claims about people today. They demonstrate how a relationship between places can differ from a relationship between people.
Robinson’s example also shows why a polished map can be persuasive without settling an individual question. Each state can be correctly colored according to its own rate, yet the map does not show the literacy status of individual foreign-born and native-born residents. The missing information is not fixed by using more decimal places or drawing a more attractive chart.

How it differs from correlation and Simpson’s paradox
The ecological fallacy is not simply another name for confusing correlation with causation. Correlation can fail to establish cause even when each person’s exposure and outcome are measured. The ecological problem arises earlier: a relationship among groups is being used to claim a relationship among individuals, although the paired individual information may be missing. Both problems can occur in the same study.
It is also related to, but distinct from, Simpson’s paradox. Simpson’s paradox describes a pattern that reverses when data are combined or divided into groups, often because group sizes differ. An ecological fallacy is an unsupported move between levels of analysis. A reversal can make that mistake especially visible, but an ecological claim can be unjustified even when no reversal has been demonstrated.
The reverse mistake is possible too. A relationship observed among individuals does not automatically establish the same relationship among neighborhoods or countries. For example, the fact that individual commuters with longer trips are more likely to drive would not, by itself, prove that cities with longer average commutes have higher driving rates. City design and the mix of available transport can affect the group comparison.
How to read a group-level claim
Start by asking what each dot, row, or colored area represents. Is it a person, a household, a school, a county, or a country? Then compare that unit with the wording of the conclusion. “Counties with higher average income have higher vaccination rates” is a county-level statement. “Higher-income people are more likely to be vaccinated” is an individual-level statement and needs evidence that connects income and vaccination for the same people.
Next, look for the missing cross-tabulation or linked individual records. A well-designed survey may measure both characteristics for each respondent and estimate how they relate. Researchers can sometimes use aggregate data and statistical models to estimate individual patterns, but the answer depends on assumptions and may remain uncertain. Estimates should not be treated as direct observations simply because they are precise-looking.
Finally, consider what the group comparison is genuinely suited to answer. A city deciding where to add services may need neighborhood-level rates and population counts even if it cannot identify each resident. Area data can reveal uneven access, prompt further questions, and guide follow-up research. They can also protect privacy when individual records cannot be released. Their value depends on matching the claim to the level of evidence.
A good habit is to keep the group in the sentence when the data describe groups. That small change preserves what the evidence shows while leaving room for what it does not. To learn about individuals, look for evidence that follows the individual connections rather than assuming those connections are hidden inside the average.
Further reading: David A. Freedman, Ecological Inference and the Ecological Fallacy; U.S. Census Bureau Center for Economic Studies, research on ecological inference using census data.





Add comment