 Akshay Dinesh
A glass of water is easy to count. A shirt, a bowl of rice, a chocolate bar, or a phone is harder. Each of those products has a water history: rain that fed a crop, irrigation pumped from a river, water used in a factory, and water needed to handle pollution left behind. A water footprint is a way to make that hidden history visible. It does not mean water is literally trapped inside a product. It means freshwater was consumed, evaporated, polluted, or otherwise tied up somewhere along the path from raw material to finished good.
The idea is useful because water problems are almost always local. A tomato grown with rainfall in a wet region does not carry the same pressure as a crop irrigated from an overstressed aquifer. A cotton shirt may look simple on a store shelf, but its water story may pass through fields, gins, mills, dye houses, shipping routes, and washing machines. Water footprints help learners ask a better question than “How much water did I use today?” They ask where the water came from, what else depended on it, and whether the use made sense in that place.
What a Water Footprint Measures
The Water Footprint Network defines a water footprint as the volume of freshwater used to produce goods and services, including water consumed and water polluted. That broad definition matters. If a factory withdraws water from a river, treats it, and returns it clean, the local impact is different from water that evaporates from a field or becomes too polluted for easy reuse. Water footprints try to separate those situations so the number does not hide the geography.
Researchers often divide water footprints into three parts. Green water is rainwater stored in soil and used by plants. Blue water is surface water or groundwater taken from rivers, lakes, reservoirs, or aquifers. Grey water is an estimate of the freshwater needed to dilute pollutants enough to meet water-quality standards. These categories are not perfect, but they prevent one common mistake: treating all water use as if it creates the same kind of pressure.
Green water can be relatively low-stress when crops grow in a rainy region where the water would mostly stay in the local soil-and-plant cycle. Blue water often deserves closer attention because rivers and aquifers are shared by farms, cities, ecosystems, power plants, and industries. Grey water reminds us that water quantity is not the only issue. Pollution can make water less useful even when plenty of liquid still exists in the river or groundwater system.
Why Food Often Has a Large Hidden Water Story
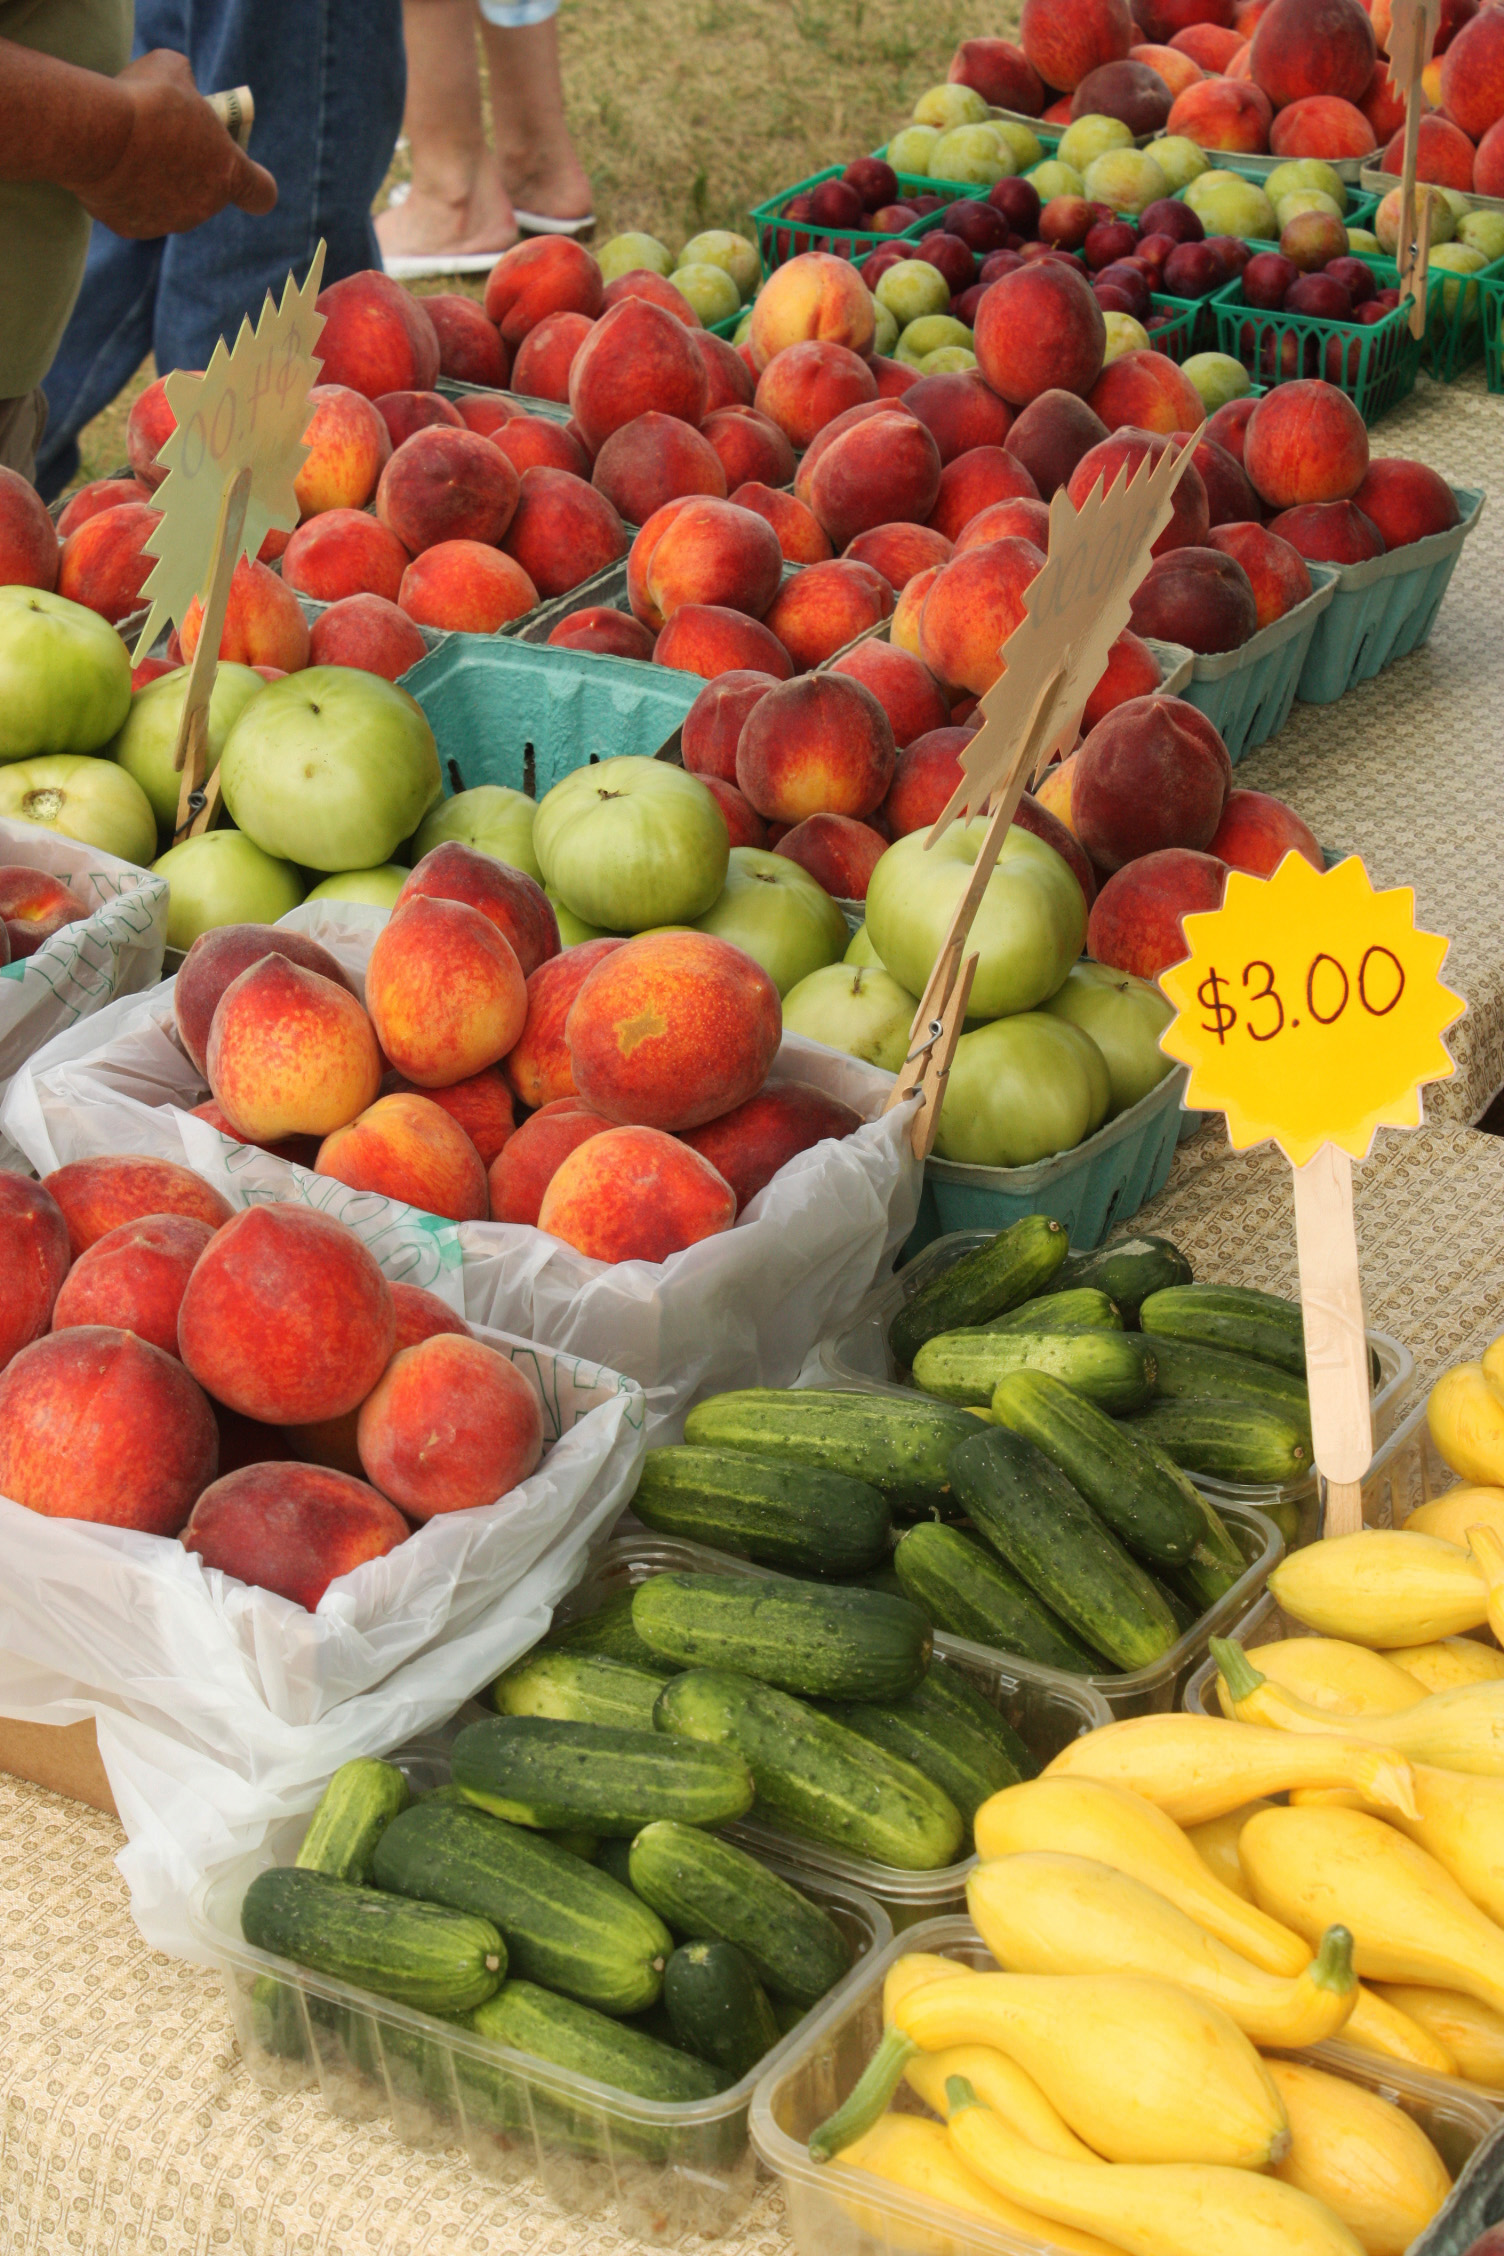
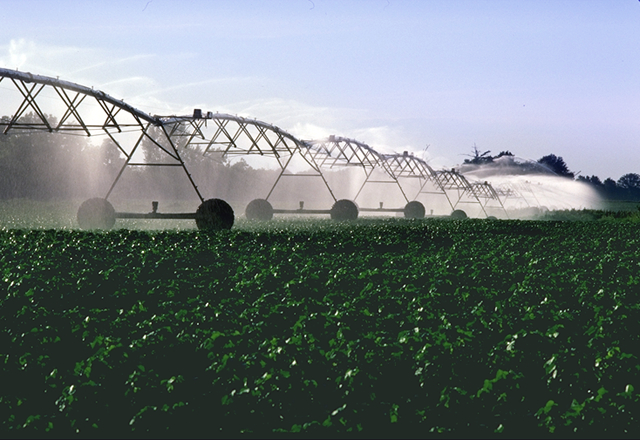
Food is one of the easiest places to see water footprints because crops and animals depend directly on water. Our World in Data summarizes global water-use data showing that agriculture accounts for roughly 70 percent of freshwater withdrawals worldwide. That does not mean every food is equally water intensive, and it does not mean all farms are careless. It means food systems sit at the center of the world’s water budget because plants need water to grow, animals need feed and drinking water, and processing often adds more water use later.
A single food item can combine several kinds of water. Wheat may rely mostly on rain in one region and irrigation in another. Rice may be grown in flooded fields where water management is part of the farming system. Beef carries the water used to grow feed crops as well as the water used directly by animals and processing facilities. Almonds, cotton, corn, tomatoes, and lettuce can each have very different footprints depending on climate, irrigation source, yield, and farming method.
This is why water-footprint comparisons need care. A chart that lists average liters per kilogram can be useful for noticing broad patterns, but it can also flatten important local differences. A crop grown in a dry basin with falling groundwater levels may create more stress than the same crop grown in a wetter place. A high-yield farm may spread water use across more food. A rainfed crop may have a large green-water footprint but place less demand on rivers and aquifers than an irrigated crop in a drought-prone region.
Food waste also changes the picture. If bread, fruit, milk, or meat is thrown away, the water used to produce it has already been spent. Reducing waste can lower a household’s indirect water footprint without requiring anyone to memorize long tables of product numbers. The most practical lesson is not that every shopper must calculate every purchase. It is that hidden water becomes easier to respect once we remember that food begins as a living system, not as a package.
How Products Move Water Across Places
Water footprints become especially interesting when products cross borders. The phrase virtual water describes water embedded in goods through production. When a country imports grain, coffee, cotton, or fruit, it is also importing the water used to grow and process those goods somewhere else. That can reduce pressure at home, but it may shift pressure to another region if the product comes from a water-stressed basin.
Virtual water trade is not automatically good or bad. In some cases, trade can save water globally when water-intensive crops are grown in places where climate, soil, and farming systems make production more efficient. In other cases, trade can disguise local damage. A consumer may enjoy a cheap product without seeing the depleted river, strained aquifer, or polluted runoff connected to its production. The geography is hidden, but the consequences are still real.
Cotton is a strong example because it connects agriculture, clothing, climate, and industry. Cotton plants need water to grow, and cotton fiber may later be cleaned, spun, woven, dyed, finished, shipped, worn, washed, and eventually discarded or recycled. A cotton shirt’s water footprint is not only about the field. It also reflects how and where the fiber was processed and how long the clothing is used. Keeping a garment longer, buying fewer rarely worn items, and washing full loads can matter because the original water cost is spread over more use.
Why the Same Number Can Mean Different Things
A water footprint number is not a final verdict by itself. Ten gallons used in a rainy region with strong water management is not the same as ten gallons pumped from an overdrawn aquifer during a long drought. Timing matters too. Irrigation during a wet season may have different consequences than irrigation at the end of a dry summer when streams are low and ecosystems are under stress.
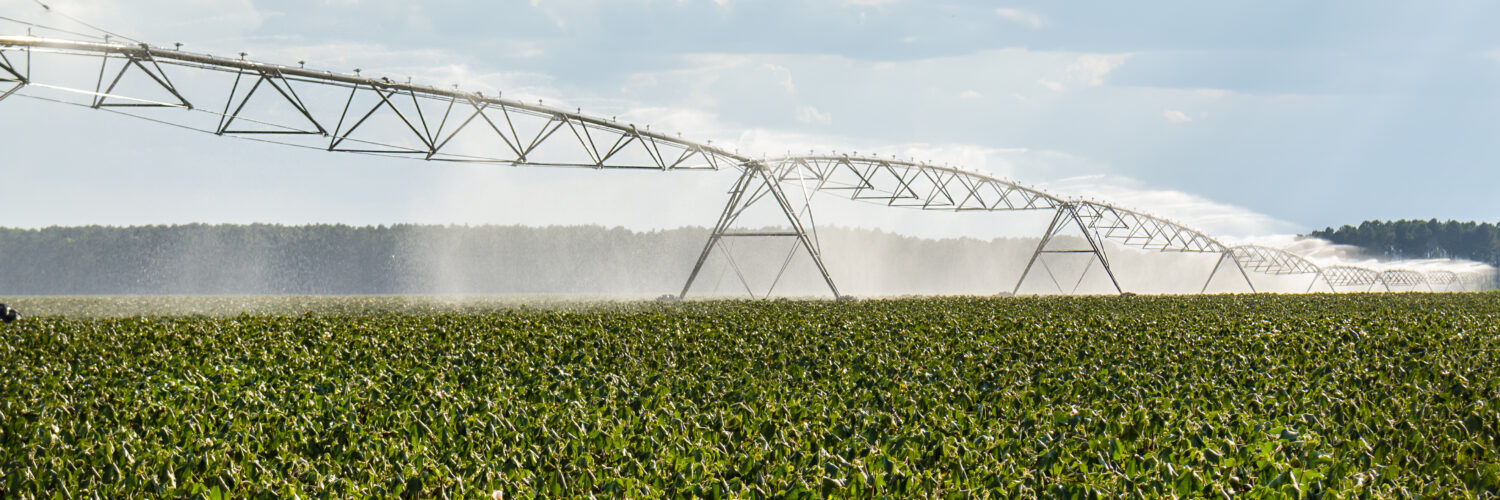
USGS research on water use across the conterminous United States helps show the scale of the difference between withdrawal and consumption. For crop irrigation during water years 2010 through 2020, USGS estimated average withdrawals of about 105,497 million gallons per day and consumptive use of about 75,698 million gallons per day. Withdrawn water is water taken from a source. Consumed water is the portion that is not quickly returned because it evaporates, transpires through plants, or becomes part of a product. That distinction is central to water-footprint thinking.
Pollution adds another layer. Fertilizer runoff, dye residues, industrial chemicals, or untreated wastewater can raise the grey-water footprint of a product. The issue is not only how much water entered the system. It is also what condition the water was in afterward. A smaller withdrawal with poor pollution control can still damage a river. A larger withdrawal with careful reuse and treatment may create less harm than the raw number suggests.
This is why serious water-footprint analysis looks at basins, seasons, sources, and local water stress. It asks whether a product depends on rain, rivers, reservoirs, groundwater, or a combination. It asks whether the area has enough water for people and ecosystems. It asks whether pollution controls are strong. The deeper question is not “Which product has the scariest number?” It is “Where is the pressure, and what choices would reduce it?”
Using Water Footprints Without Oversimplifying
Water footprints are most useful when they change how people see everyday systems. They reveal that a city’s water use is not limited to showers, lawns, and taps. It also includes the food on plates, the fibers in clothing, the electricity mix behind devices, and the supply chains that bring goods from distant places. Direct conservation still matters, especially in dry regions, but indirect water use often reaches much farther than the kitchen sink.
For students, the concept is a powerful bridge between geography and daily life. It connects climate, trade, agriculture, manufacturing, pollution, and consumer habits in one practical idea. A classroom discussion can compare two crops, trace the water behind a school lunch, map where cotton or coffee grows, or ask why an imported product may carry water pressure from another continent. The point is not guilt. The point is systems thinking.
For households, the most realistic steps are usually simple. Waste less food. Use clothing and electronics longer before replacing them. Pay attention to local water restrictions. Support water-efficient farming and manufacturing when reliable information is available. Be cautious with product claims that sound precise but do not explain location, source, or pollution. A water footprint should start a better question, not end the conversation.
The hidden water in everyday products is not hidden because it is mysterious. It is hidden because modern life separates consumers from the places where things are grown and made. Water footprints pull those places back into view. They show that every product has a geography, and that smarter choices begin with seeing the rivers, fields, aquifers, and people behind ordinary objects.