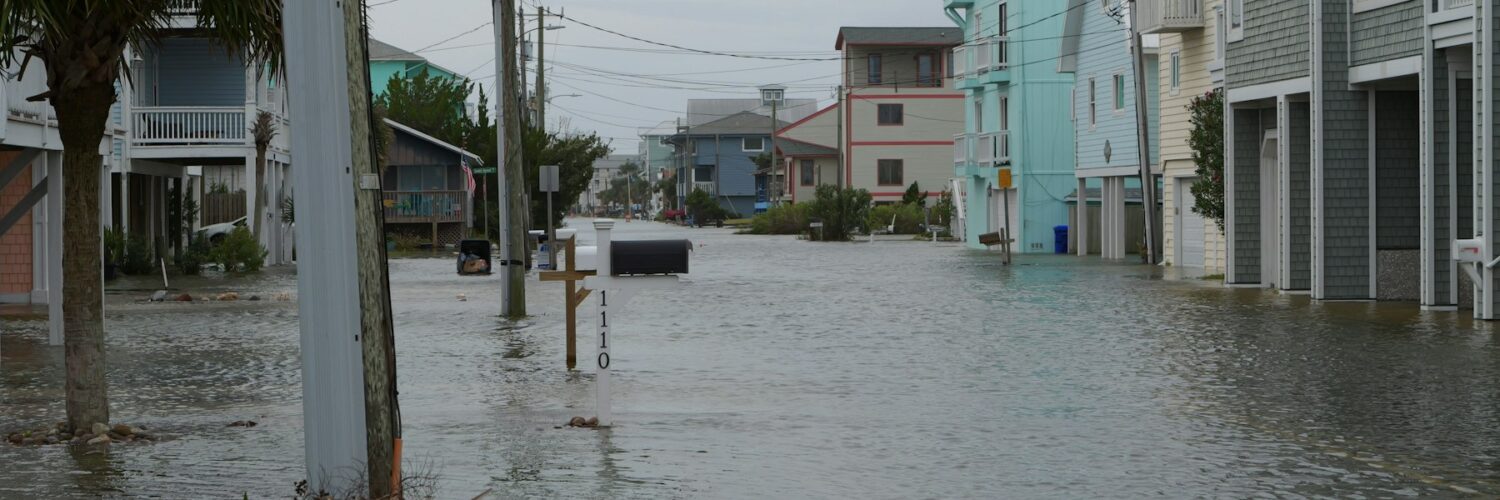
A flood map looks calm compared with a flooded street. It uses lines, colors, labels, and elevations instead of rushing water, stranded cars, or sandbags at a doorway. But those quiet markings can tell an important story long before a storm arrives: where water has room to spread, how often flooding is expected, and which places may face higher risk than they appear to on a sunny day.
For students, families, and community members, flood maps are also a geography lesson in plain sight. They connect rivers, coastlines, slopes, drainage systems, buildings, insurance rules, and public safety decisions. Reading one well does not require advanced math, but it does require a few careful habits. The most important is to treat the map as a risk tool, not a promise that water will or will not reach a certain address.
What a Flood Map Is Really Trying to Show
In the United States, the best-known flood maps are FEMA Flood Insurance Rate Maps, often called FIRMs. FEMA’s Map Service Center describes itself as the official public source for flood hazard information used by the National Flood Insurance Program. These maps help communities set floodplain rules, help lenders decide when federally backed mortgages require flood insurance, and help residents understand which areas have been identified as higher risk.
The map is built from geography. Engineers and mapping specialists study streams, coastlines, rainfall, ground elevation, storm surge, drainage patterns, levees, and historical data. The result is not a picture of one past flood. It is a model of flood hazard under defined conditions, especially the flood that has a 1 percent chance of being equaled or exceeded in any given year.
That 1 percent annual chance area is often called the 100-year floodplain, but the nickname causes trouble. It does not mean a flood happens only once every 100 years, and it does not mean an area is safe for the next 99 years after a major flood. It means that, based on the analysis used for the map, the location has a 1-in-100 chance of reaching or exceeding that flood level in any single year. Over the length of a 30-year mortgage, repeated annual chances add up to a much larger possibility of seeing flood damage.
Why Flood Zones Matter
Flood zones are shorthand labels for different kinds and levels of flood hazard. Zone A and Zone AE usually point to areas with at least a 1 percent annual chance of flooding. Coastal V zones mark places where waves and fast-moving coastal water can add extra force. Zone X may indicate lower mapped risk, though that does not mean no risk. Local details matter, and flood maps should always be read with the legend and the specific map panel, not from memory alone.
One of the most useful map ideas is the Special Flood Hazard Area. This is the area where the National Flood Insurance Program generally treats flood risk as high enough to trigger stronger floodplain management rules. If a building with a federally backed mortgage is in this area, flood insurance may be required. Even outside that boundary, flooding can still happen from heavy rain, clogged drainage, small streams, failed infrastructure, or storms larger than the mapped event.
Another key term is Base Flood Elevation, or BFE. FEMA defines it as the elevation of water from a flood with a 1 percent chance of equaling or exceeding that level in a given year. On many detailed maps, BFE gives builders, planners, and property owners a reference point: how high water is expected to rise during the base flood. The difference between a building’s lowest floor and the BFE can affect construction choices, insurance pricing, and mitigation plans.
This is where flood maps become more than colored zones. A house and a road can sit in the same broad mapped area but face different consequences because of floor height, foundation type, drainage, nearby channels, or the direction water is likely to move. Two buildings only a short distance apart may have different exposure if one sits on slightly higher ground or behind a natural ridge.
The Map Is Not the Same as the Storm
A flood map is usually about long-term hazard. A weather forecast is about what may happen soon. Those two tools answer different questions. FEMA maps help people understand mapped floodplain risk for planning, insurance, and development. National Weather Service forecasts and warnings focus on current or expected water, rainfall, and river conditions.
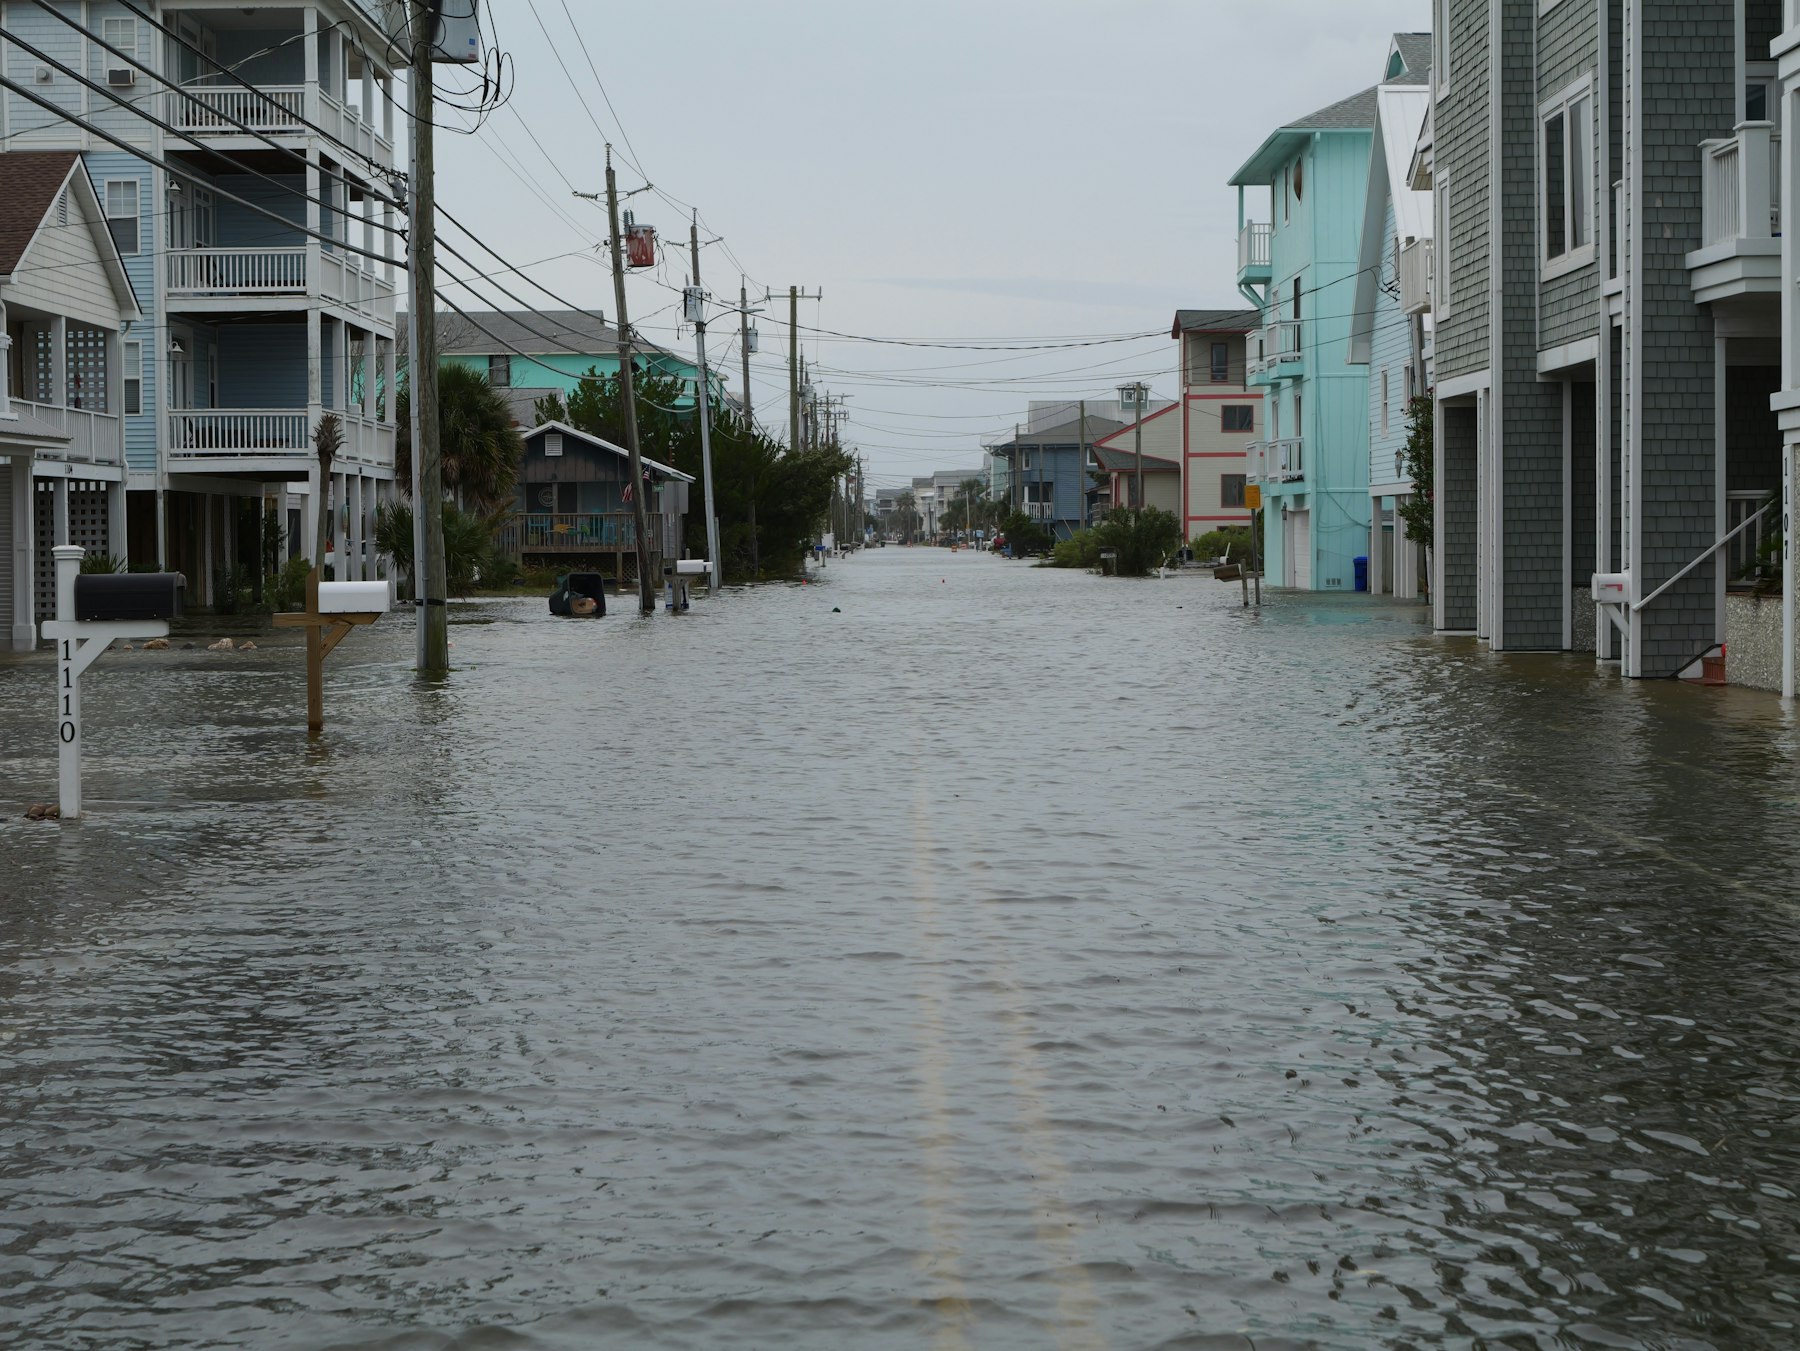
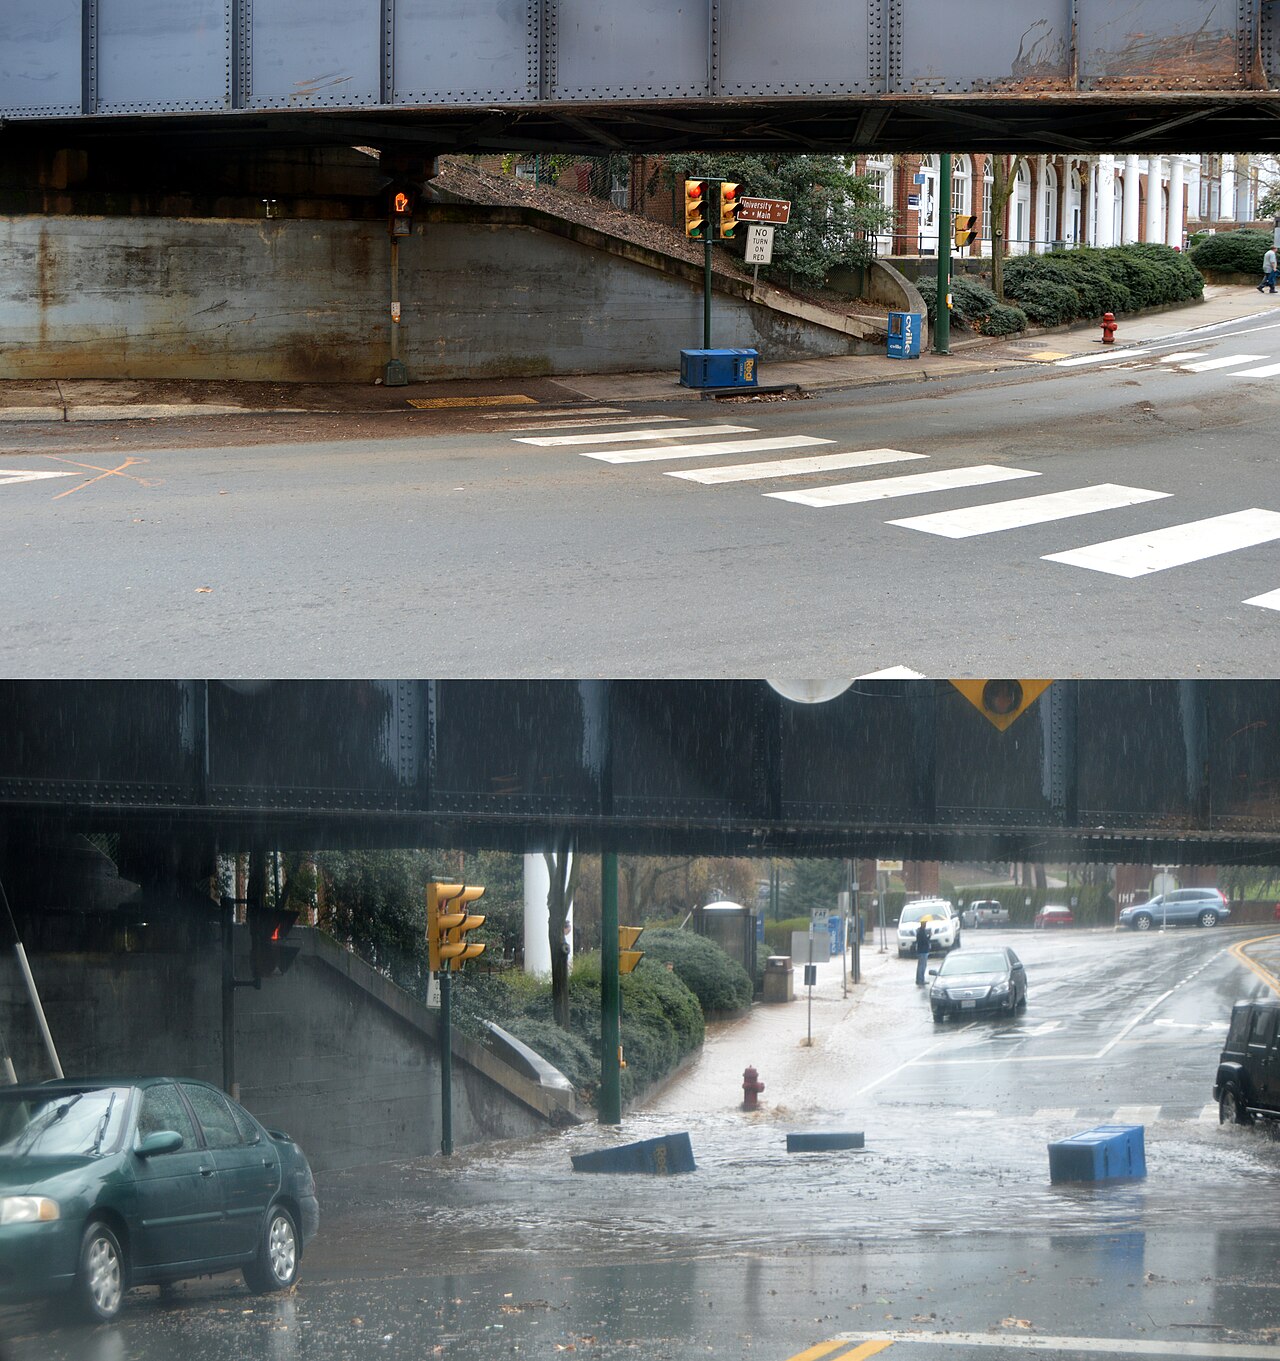
That distinction matters during a real storm. A place outside a mapped high-risk zone can still flood if rain falls faster than drains can carry it away. Urban streets can flood when pavement blocks absorption and stormwater systems are overwhelmed. A small creek can rise quickly after heavy rain upstream. Coastal water can push into neighborhoods through storm surge, tides, rainfall, or a combination of all three.
Newer flood inundation mapping tries to fill part of that gap. NOAA’s National Water Prediction Service has been expanding maps that show where river flooding may be occurring or forecast, with services available for a growing share of the U.S. population. These maps are designed to be more event-focused, showing possible water extent at a neighborhood scale when rivers rise. They do not replace FEMA flood maps, but they help explain a different question: if the water reaches this level now or soon, which places may be covered?
Why the Lines Can Change
Flood maps are not permanent. FEMA notes that flood maps are continually updated through different processes, and a printed or downloaded map can be replaced by newer information. A community may receive preliminary maps before final adoption, and local officials, engineers, residents, or property owners may review changes before they become effective.
Several things can shift the lines. Better elevation data can reveal small changes in ground height that older maps missed. New rainfall records can change estimates of how much water may move through a watershed. Development can replace fields or forests with roofs, roads, and parking lots, sending runoff into drains and streams more quickly. Erosion, sea level rise, land subsidence, levee changes, and channel modifications can all affect how water behaves.
Sometimes a map change is technical. A property owner may request a Letter of Map Amendment or another map change if better elevation evidence shows that a structure or parcel has been mapped incorrectly. Other changes are broader, affecting whole neighborhoods or river corridors. Either way, the map is a living public record of risk analysis, not a frozen description of the landscape.
Insurance pricing has also moved beyond simple zone labels. Under FEMA’s Risk Rating 2.0 approach, flood insurance rates can consider more variables, including flood frequency, different flood types, distance to water, elevation, and building characteristics. That does not make the flood map irrelevant. It means the map is one important layer inside a larger risk picture.
How to Read a Flood Map More Carefully
The first step is to find the official map source. FEMA’s Map Service Center lets users search by address, place, or coordinates and download official flood hazard products. Local governments may also provide interactive floodplain viewers, but the official source matters when decisions involve regulations, mortgages, or insurance requirements.
Next, look beyond the color around one point. Check the zone label, the legend, nearby streams or coastlines, the Base Flood Elevation if one is shown, and whether the map panel is effective or preliminary. Notice how close the location is to a zone boundary. A house just outside a line is not magically safer than a house just inside it; the line marks a modeled boundary, not a wall.
It also helps to compare map risk with local evidence. Are nearby roads known to flood during heavy rain? Does water collect in low spots after storms? Has the neighborhood changed since the map was made? Are there drainage ditches, culverts, levees, seawalls, or wetlands nearby? Geography is not only the map layer on a screen. It is the shape of the ground, the movement of water, and the way people have built around both.
A careful reader should also ask what kind of flooding the map emphasizes. River flooding, coastal storm surge, shallow sheet flow, heavy rainfall, and drainage backups do not always appear in the same way. A map that is useful for one type of hazard may not fully describe another. That is why flood risk is best understood through several sources: official FEMA maps, local floodplain information, weather forecasts, river gauges, emergency alerts, and the lived history of a place.
What Flood Maps Teach About Living With Water
Flood maps can feel technical, but the question behind them is simple: where can water go when there is more of it than usual? Rivers need room to spread. Coastlines shift under storms and tides. Rain follows gravity through streets, ditches, yards, and pipes. Human choices can reduce risk, but they cannot erase the basic geography of water moving downhill and outward.
The value of a flood map is that it makes hidden risk visible before the emergency. It can show why a low road is repeatedly closed, why one neighborhood has stricter building rules, why raised foundations matter, or why insurance may be worth considering even outside the highest-risk zone. It can also reveal unfairness: communities with fewer resources may face old drainage systems, limited mitigation funding, or homes built before modern flood rules.
Good map reading does not create certainty. It creates better questions. What does the line mean? How old is the information? What kind of flood is being shown? What lies uphill and upstream? What would happen if the storm were bigger than the mapped scenario? Those questions turn a flood map from a confusing government document into a practical geography tool.
Water does not care about map labels, but people need labels to plan. Flood maps are one way to translate landscapes into decisions before the water arrives. Read carefully, they help communities see risk early, build more wisely, and understand why a street that looks ordinary most days may still belong to a much larger floodplain story.


Add comment